


Charles Hugh Smith
My articles My offerMy siteAbout meMy videosMy books
Follow on:TwitterFacebookYoutubeAmazon
|
So enjoy the GBOAT (greatest bubble of all time) but watch the clock. Sports fans debate who qualifies as GOAT–the greatest of all time: in hoops, Kobe, Jordan, Kareem, Magic; in boxing, Ali, and so forth. What we have today is GBOAT–the greatest bubble of all time That it’s GOAT is beyond doubt, as the charts below reveal. Bubbles have a few unique characteristics which cannot be captured by financial metrics. The most important such characteristic is that mainstream financial managers don’t see it as a bubble. For those who do admit valuations may be a bit stretched (heh), these professionals shrug and say that since the music’s still playing, they have to keep dancing, i.e. yes there may be a bubble but it won’t pop anytime soon. The other characteristic of a bubble is that it continues expanding far beyond historic valuation redlines, as if nothing in the real world (earnings, multiples, etc.) actually matters. Anyone proclaiming such extremes are unsustainable is laughed off the stage as extremes become more extreme, and those who bet against the tsunami of euphoric confidence that this isn’t a bubble can be found huddled in a cardboard box beneath the freeway overpass, begging for a handful of Cheetos. |
Wilshire Total Market Cap Index vs. Nominal GDP, 1972-2020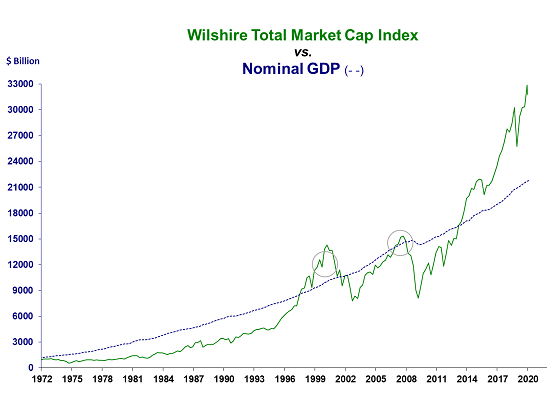 - Click to enlarge |
| Another characteristic worth noting is the acceleration of duration, amplitude and volatility as bubbles reach their zenith. So while bulls are cheering the greatest post-election rally in 73 years (or was it 743 years? 2,743 years? Whatever…), they should be quaking in their designer boots for what increasingly manic rallies are signaling: it’s about to pop, baby.
Jesse Felder of TheFelderReport.com succinctly summarized the case for GBOAT in This Is The Textbook Definition Of “Late Cycle” In The Stock Market (Zero Hedge). The charts below bolster the (painfully obvious) case for this being the Wilshire total stock market capitalization to nominal GDP: record disconnect from GDP. Regression to trend: all-time high. (via advisorperspectives.com) |
S&P Composit Index: Regression to Trend, 1870-2020 - Click to enlarge |
| Private sector financial assets as a percentage of GDP: all-time high. |
US Private Sector Financial Assets, 1950-2020 - Click to enlarge |
| Every leg higher takes less time and reaches greater extremes:
So enjoy the greatest bubble of all time but watch the clock. Those Cinderella gains vanish at midnight. |
S&P 500 Large Cap Index, 2003-2020(see more posts on S&P 500 Large Cap Index, )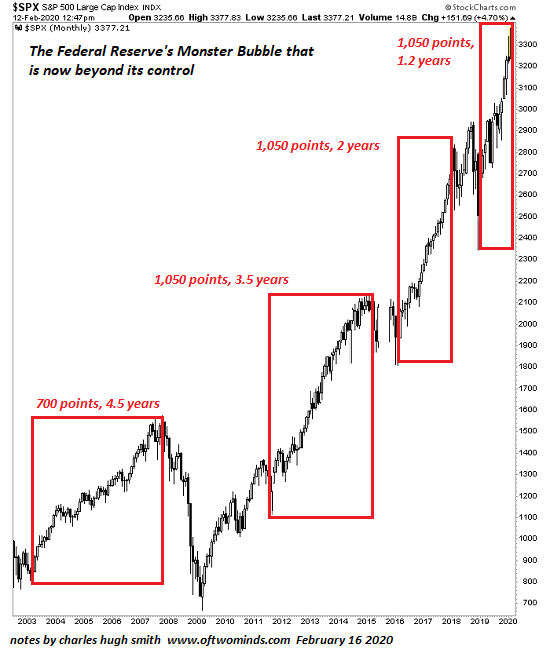 - Click to enlarge |
Full story here Are you the author?
Tags: Featured,newsletter


