


It has become nearly commonplace for pundits and politicians to claim that Americans are working more than ever before; that they’re working more jobs, and working longer hours — all for a lower income.
During the Democratic debates this summer, for instance, Rep. Tim Ryan of Ohio claimed “the economic system now forces us to have two or three jobs just to get by.” Kamala Harris made similar comments.
These claims echo statements from Elizabeth Warren in Alexandria Ocasio-Cortez. In a July 2018 interview, Ocasio-Cortez insisted “Unemployment is low because everyone has two jobs.
Unemployment is low because people are working 60, 70, 80 hours a week and can barely feed their family.” That same month, Warren stated “people” are “working two, three, or four jobs to try to pay the rent and keep food on the table.”
Ocasio-Cortez was the only one in this group unwise enough to claim “everyone” is working incredibly long hours, but the general sentiment is clear enough: a lot of people are working harder and longer just to attain even a basic standard of living.1
Fortunately, this doesn’t appear to be the case at all. While it is no doubt true that some people work multiple jobs, and many work long hours, it is not clear that this situation is new, or that it has become worse in the past decade.
In fact, in response to Harris’s comments, The Washington Post reported that the number of working Americans with more than one job is lower now than the mid-90s:
In all, there are 7.8 million people who hold more than one job — just 5 percent of Americans with jobs . The percentage has been roughly steady since the Great Recession, and in fact is lower than in the mid-1990s, when it hovered around 6 percent.
Nor can we guess from the data as to why people were working more hours or working more than one job.
It cannot be just assumed that people work more only because they risk hunger and eviction from their homes, without those extra hours. After all, there is a growing body of research showing that it is high-income workers who are most prone to working longer hours. For example, according to one study, the authors found
Between 1979 and 2002, the frequency of long work hours increased by 14.4 percentage points among the top quintile of wage earners, but fell by 6.7 percentage points in the lowest quintile.
When we see evidence of rising work hours, it’s often a safe guess that among those working more are many higher-wage workers. These people are not working “60, 70, 80 hours a week” to “keep food on the table.”
This reverses the status quo of the past (i.e., the 1970s and before) when lower-income workers tended to work more. But, in a 2006 study, economists Mark Aguiar and Erik Hurst studied work and leisure trends over the last 40 years.
They noticed that, in the 1960s, most men—regardless of their education, which serves as a proxy for income—worked the same amount of hours, about 50 per week, and spent about 105 hours dedicated to leisure activities. By 2003, a divergence emerged that mirrored growing income inequality: Men with less than 12 years of education worked, on average, 37.5 hours a week, while more educated (higher earning) men worked 43.4 hours. Both groups gained more leisure time (socializing, watching TV, playing sports), though the less educated group spent about 6 to 7 more hours a week engaged in leisure activities than their more educated (and presumably higher earning) peers.
| This, incidentally, has increased measures of income inequality overall. Higher income workers are electing to work more, while middle-and lower income workers opt for leisure. Since government measures of money income can’t take into account the benefits of leisure, we then see an increased difference between the two groups.
Another complicating factor is the fact many workers choose to work more when the economy is doing well. Thus, during periods of significant income gains, we might also see increases in working hours. Using numbers from the University of Groningen, we can see these trends at work in recent decades: |
Average Annual Hours Worked by Persons Engaged for United States, Hours, Annual 1950-2017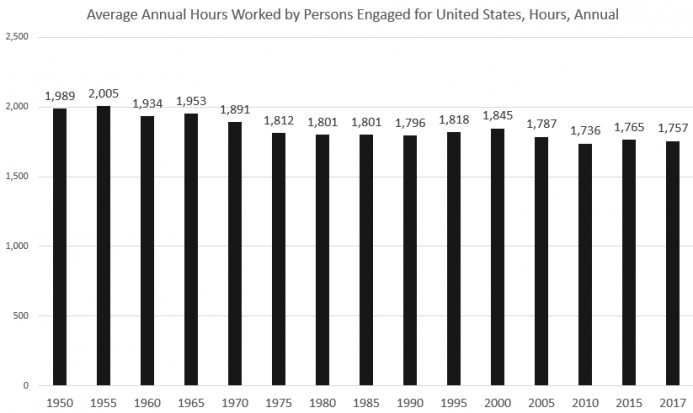 - Click to enlarge |
| Overall, annual working hours have declined in recent decades, although we do find that working hours increased — with some ups and downs — from the early 80s to the end of the Dot-Com boom in 2000. This was also a period during which median incomes increased sizably for most groups. The direction of causality probably goes both ways. As job opportunities grew during this time, many people took advantage of the situation and worked longer hours when they could, so as to increase purchasing power and their standards of living. As a result, both personal and household incomes went up. We can see how working hours tend to track with the business cycle using a the Bureau of Labor Statistics’ numbers for average weekly hours:
It should not be assumed that most people were working longer hours simply because they were headed toward the poverty line. Nor can it be assumed workers prefer leisure to additional consumption. One example which suggests the American preference for consumption over leisure is the fact the size of American houses have increased in recent decades even as household sizes have decreased. Presumably a declining household size implies square-footage needs also decline. Yet, many Americans continue to opt for more spacious living quarters, which drives a greater need for more money income, and often longer hours. Yet, even as working hours have remained largely flat over the past generation, example, real incomes have increased. From 1980 to 2017, the median income increased 14 percent for men, and 24 percent for women. But using weekly average hours numbers from the Bureau of Labor Statistics, weekly average hours increased only 0.5 percent over the same period from 38.5 hours to 38.7 hours. Since the end of the Dot-Com boom in 2000, of course, median incomes have largely flattened. There was no change at all for men from 2000 to 2017, while the increase for women was 12 percent. But during that time, average weekly hours fell 0.5 percent for women, and fell 3.7 percent for men. Government income statistics, however, measure only money income, so the increased leisure is measured as zero income. |
Average Weekly Hours at Work in All Industries 1976-2017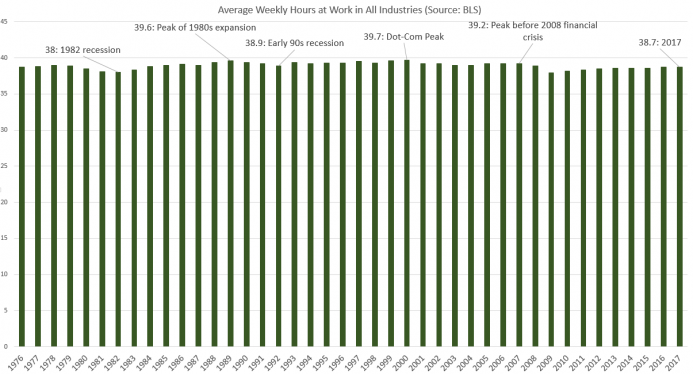 - Click to enlarge |
The Larger TrendOverall, working hours haven’t moved much in the past forty years — although incomes have increased significantly over that period. But, working hours are still well down from where they were during the first half of the twentieth century — at least for full-time workers. Weekly work hours plummeted from 60 per week in 1890 to 40.25 in 2000, according to calculations by Michael Huberman and Chris Minns.2 Civilian working hours collapsed between 1929 and 1950 due to the great depression and the Second World War, but averages have rarely exceeded 40 hours ever since. Researchers Valerie A. Ramey and Neville Francis, on the other hand, contend this drop-off is overstated, and they opt for a different method that shows a decrease of only 16 percent between 1900 and 2005, dropping from 27.7 hours to 23 hours worked per person. (The real median income likely quadrupled during this period.) But even the more modest gains showed by Ramey and Francis point to broad declines in work time. For example, since 1900, weekly work hours for children in the 10 to 13-year-old range decreased from 5.2 hours per week to zero hours per week in every year since 1940. Weekly work by teenagers (ages 14-17) has also collapsed, dropping from 20 hours per week in 1900 to 2.9 hours in 2005. Meanwhile, Americans are clearly retiring earlier since weekly work in the over-65 population fell from 19.3 weekly hours in 1900 down to 4.2 weekly hours in 2005. |
Hours of Work per Week of Full-Time Production Workers, 1870-2000 - Click to enlarge |
| This gains appear to have been made possibly by the continued labor of workers in the 25-54 subset. Accoridng to Ramey and Francis, these workers have not seen any decline in total hours since 1900, although their standard of living has certainly increased. From 1900 to 2005, weekly hours for the 25-54 year olds increased from 29.6 to 31.3. |
Average Weekly Hours Worked, by Age Group, 1900-2005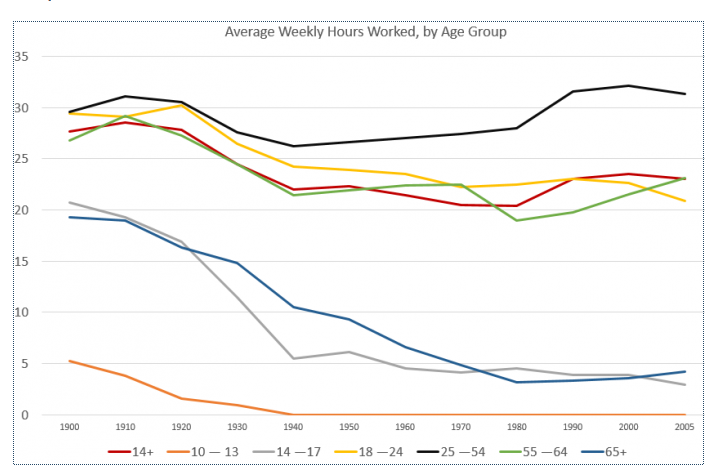 - Click to enlarge |
Women in the WorkforceThis increase, however, has been largely fueled by women joining the workforce. Weekly hours worked by males — even in the 24-54 group — declined by 25 percent during the twentieth century, and remains down from the alleged “good ol’ days” of the 1950s and 1960s. Declines in working hours for males were even larger in all other age groups. For women, however, weekly hours worked increased substantially, but mostly for women in the 25-64 range. For women aged 25-54, weekly hours increased from 7.9 in 1900 to 26.1 in 2005. Seeing this, some bearish observers of American standards of living often claim that everyone is really working much more because prior to the 1970s, women didn’t “have to” work. These critics claim that as manufacturing and other presumably high-wage jobs went into decline, women were forced to get wage work to make up the difference. The problem with this claim, however, is that as women began to join the workforce in larger numbers during the 1950s and 1960s, this did not represent a shift from leisure to work. It only represented a shift from “home production,” to production through wage work.4 Thanks to a variety of labor-saving devices, expanded schooling for children, and the introduction of part-time work, women were able to seek money income for themselves and their families without reducing overall leisure time. For example, for all women over age 14, the reduction in home production was larger than the increase in “hours worked,” leaving more time that could be devoted either to leisure or schooling: From 1900 to 2005, home production for women fell from 42.5 hours to 27.6 hours. That’s a drop of 14.9 hours. Meanwhile, “hours worked” increased by only 9.3 hours. |
Hours Spent by Women in Either "Home Production" or "Hours Worked" 1900-2005 - Click to enlarge |
| Meanwhile, weekly time spent on home production overall — including both men and women — declined for all age groups except the over-65 group.
As home production and working hours declined, this left more time for leisure and schooling. Thus, Ramey and Francis conclude that even with sizable increases in schooling in recent decades, leisure time increased across all age groups from 1900 to 2005, for men and women combined. The largest gains, not surprisingly, are found with the over-65 age group. Moreover, with growing leisure in the over-65 cohort, combined with growing life expectancies, lifetime leisure howas now reached the highest level it’s ever been. Ramey and Francis calculate “cumulative lifetime hours of leisure” increased by 11 percent from 1970 to 2000. Given that working hours as of 2017 were still lower than they were in 2000, it is likely that time devoted to leisure and schooling has increased since then, especially as the population ages and more Americans retire. |
Leisure and Schooling, 1900-2005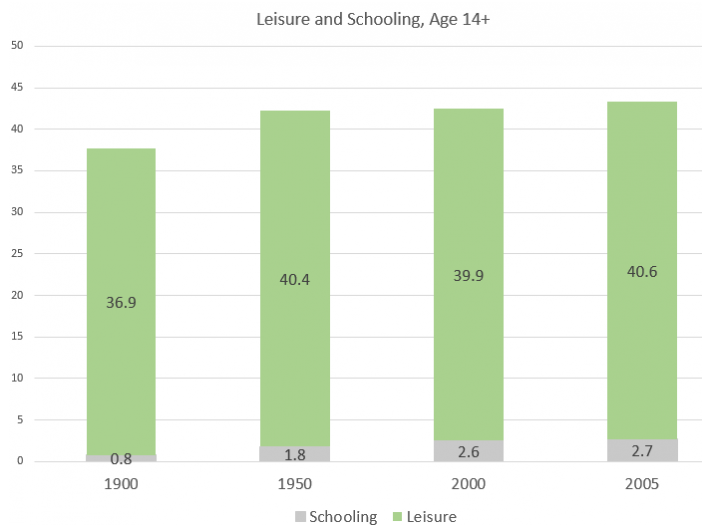 - Click to enlarge |
Full story here Are you the author?
Tags: newsletter


