Beta-driven FantasyThe decade long bull market run, aside from making everyone ridiculously rich, has opened up a new array of competencies. The proliferation of ETFs, for instance, has precipitated a heyday for the ETF Analyst. So, too, blind faith in data has prompted the rise of Psychic Quants… who see the future by modeling the past. |
 Gandalf, quant of Middle-Earth, dispensing sage advice. [PT] |
| For the big financial outfits, optimizing systematic – preprogrammed – delta hedges is an essential aptitude of the 21st century. Our guess is that many of today’s high-fliers will crash and burn during the next bear market. But what do we know?
As far as we can tell, the stock market, circa November 2019, is an absolute fantasy. The Dow Jones Industrial Average (DJIA), S&P 500, and Nasdaq have little connection to the underlying economy. Rain or shine, they go up. Market watchers, eager to explain the fantasy, employ creative nomenclature as they attempt to classify the state of the stock market with discerning acumen. Is it a bubble? Is it a melt up? If it is a melt up, what type and gradation is it? For example, Brian Sozzi, with Yahoo Finance, says the stock market is not in a bubble; we are merely experiencing a mini market melt up ahead of the holidays. Savita Subramanian, chief equity strategist with Bank of America, has a slightly different take. She thinks we are facing a beta-driven melt up to close out the year. Do you know the difference between a mini market melt up and a beta-driven melt up? Neither do we… Thus, for fun and for free, we will attempt to deduce and classify the state of the stock market – both type and gradation – on your behalf. We want to know precisely where things stand. |
S&P 500 Index, monthly(see more posts on S&P 500 Index, )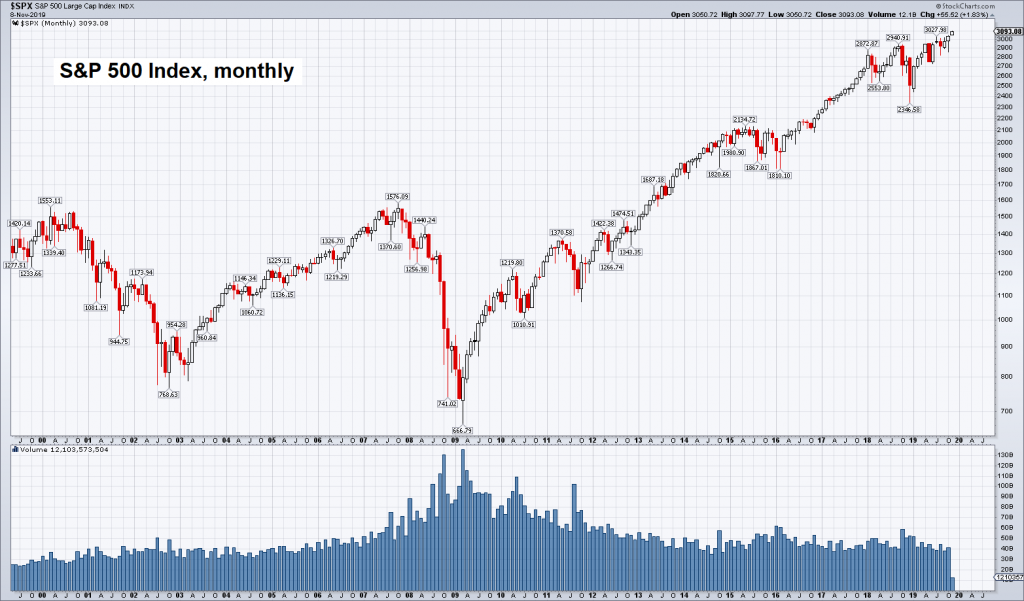 The mother of all bubbles, monthly. [PT] - Click to enlarge |
New RecordsOn Thursday the DJIA and S&P 500 both closed at all-time highs. President Trump, an ardent market hobbyist, was quick to celebrate the new records, tweeting:
Many good Americans celebrated too. Take Barry McCockiner. He was so grateful to Trump for this milestone he went to Apple Bee’s with his wife’s boyfriend and celebrated by pounding down a few beers. However, those who bothered to ponder the delusion of all time stock market highs without an equally booming economy were less sanguine. Obviously, something has gone seriously awry. Currently, the Buffett Indicator, which is the ratio of the total market capitalization over gross domestic product, is over 145 percent. A fairly valued market is a ratio somewhere between 75 and 90 percent. Anything above 115 percent is considered significantly over valued. |
The Buffett Indicator: Corporate Equities to GDP, 1950-2020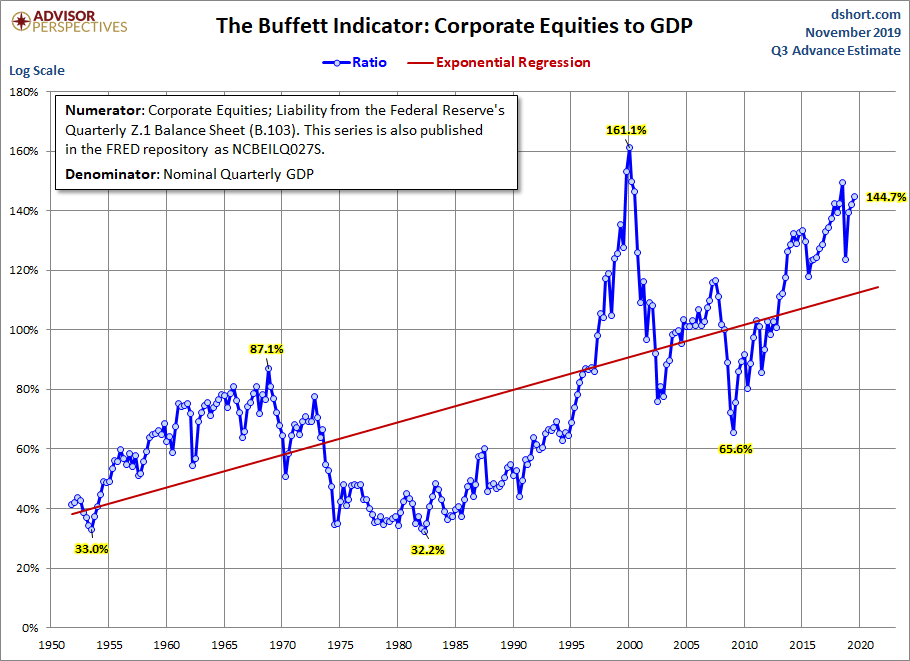 The market cap-to-GDP ratio, a.k.a. the “Buffett indicator” has risen into the blue yonder. This may explain why Berkshire Hathaway is sitting on more than $100 billion in cash. [PT] - Click to enlarge |
| The Buffett Indicator has only been higher two times: in September of last year, when it hit 146 just prior to the S&P 500’s 20 percent purge; and in March 2000, when it hit 148 just before the S&P 500 collapsed 49 percent. For perspective, the Buffett Indicator only registered 110 in September 2007, in advance of the S&P 500 crashing 56 percent
For now, though, stocks are going up. At the same time, the economy is slowing. The Chicago Purchasing Management Index (PMI) fell to 43.2 – nearly a four year low – in October. Any reading below 50 indicates deteriorating conditions. |
Chicago Business Barometer, 2005-2019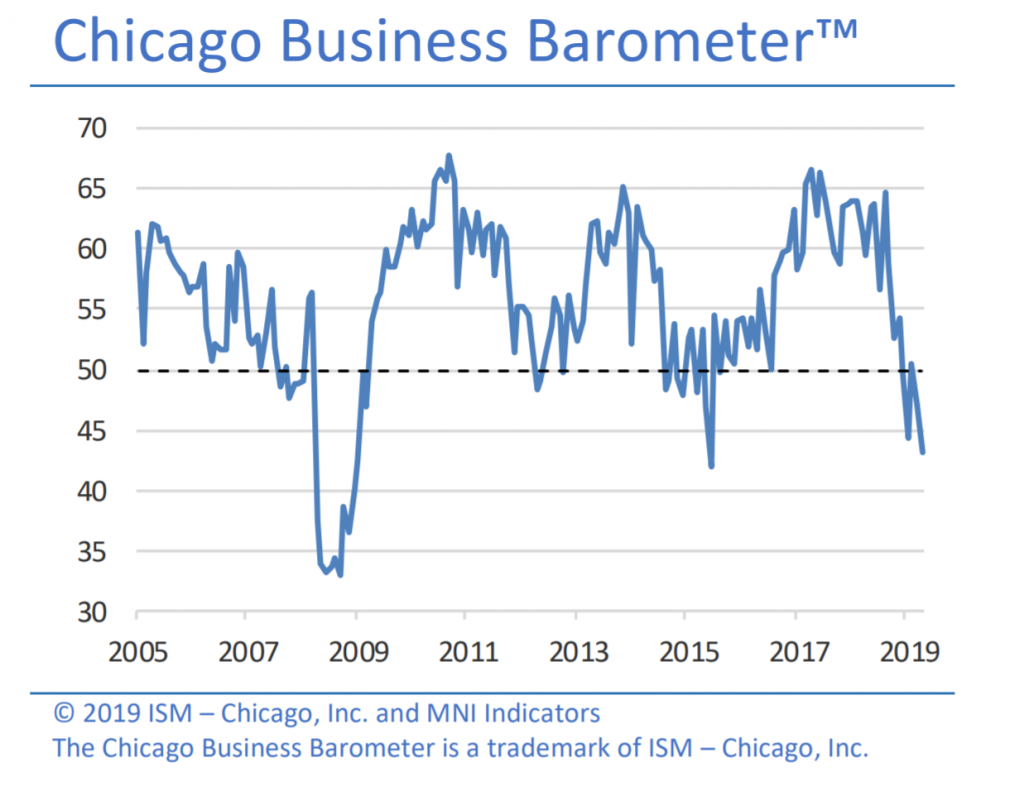 Chicago PMI – this doesn’t look very encouraging… [PT] - Click to enlarge |
| Gross Domestic Product (GDP) has also stalled out. The Atlanta Fed has lowered its Q4 growth estimate to 1 percent. Year-over-year GDP growth is just 2 percent.
What is going on? |
Atlanta Fed, GDP Now estimate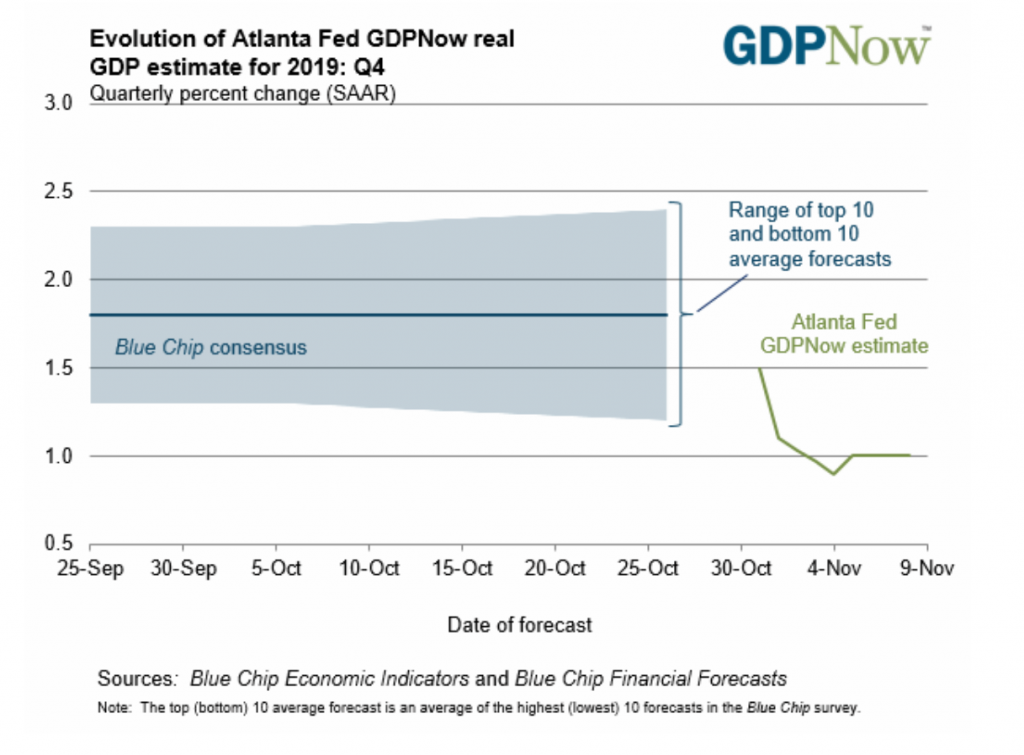 Needless to say, 1% is not the kind of growth anyone is likely to write home about. [PT] - Click to enlarge |
Riding the Type 3 Mega Market Melt Up TrainIf you follow the money back from the booming stock market to its genesis you end up at the steps of central banks, including the Federal Reserve. For the third time in 20 years, the Fed has put the investment wealth – including 401ks and IRAs – of millions of Americans at extreme risk. Naturally, this always happens at the worst possible time. Monetary policy – via insurance rate cuts – is being executed to stimulate demand in the economy. By brainlessly pursuing the illusive nirvana of 3 percent GDP growth and a 2 percent inflation target, the Fed is provoking a market melt up. And American investors are, once again, being setup to get their kneecaps broken off. To the disgrace of central bankers the world over, further monetary stimulus will not stimulate the economy. That is the experience of the last two decades. Despite massive monetary insanity the economy has slacked and slumped, while financial markets have melted up and then melted down. |
Assets held by the Fed vs. the federal funds rate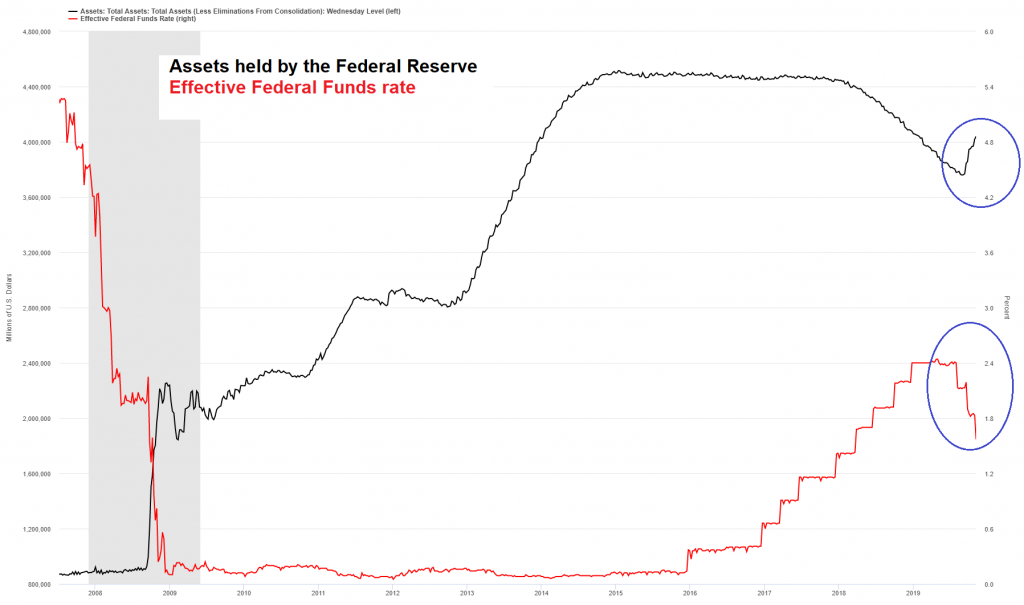 the planners are pumping all-out again. [PT] - Click to enlarge |
| So while additional monetary stimulus won’t stimulate the economy, it will stimulate additional stock price distortions and asset price bubbles. Given the massive amounts of monetary intervention being undertaken we fear you ain’t seen nothing yet…
In fact, we may be in for the train ride of a life time: DOW 30,000? DOW 40,000? DOW 100,000? Why not? With Fed Chair Powell as conductor, and the third wild ride in the last 20 years underway, this melt up will be mega. Hence, we are classifying the melt up as: Type 3 Mega. Quite frankly, the ride to DOW 30,000 – or higher – is not something to cheer and celebrate. For it is not a reflection of a booming, healthy economy. Rather, it is an expression of the pure madness and insanity of the world’s central bankers. If you have your wits about you, we suggest making a quick exit at the next station. |
 The holy mountain quant agrees completely. [PT] |
Charts by stockcharts, Advisorperspectives, ISM, Atlanta Fed, St.Louis Fed
Editing and chart & image captions by PT
Full story here Are you the author?Tags: newsletter,S&P 500 Index,The Stock Market