True Money Supply Growth Rebounds in SeptemberIn August 2019 year-on-year growth of the broad true US money supply (TMS-2) fell to a fresh 12-year low of 1.87%. The 12-month moving average of the growth rate hit a new low for the move as well. The main driver of the slowdown in money supply growth over the past year was the Fed’s decision to decrease its holdings of MBS and treasuries purchased in previous “QE” operations. This was partly offset by bank credit growth in recent months, which has moved to 6.6% y/y after being stuck below 4% y/y throughout 2018. |
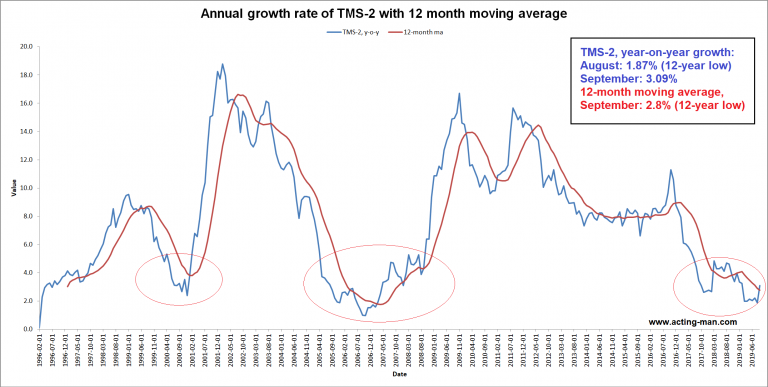
After establishing a new 12-year low at 1.87% in August, TMS-2 growth has rebounded to 3.09% in September. In 2000, the low in y/y growth coincided almost precisely with the peak in the S&P 500 index. The next major low was established in 2006, about one year before the stock market peak. It is worth noting that in both cases, money supply growth actually soared during the subsequent bear markets and recessions. This illustrates the fact that slowing and/or accelerating money supply growth exerts its effects with a considerable lag. |
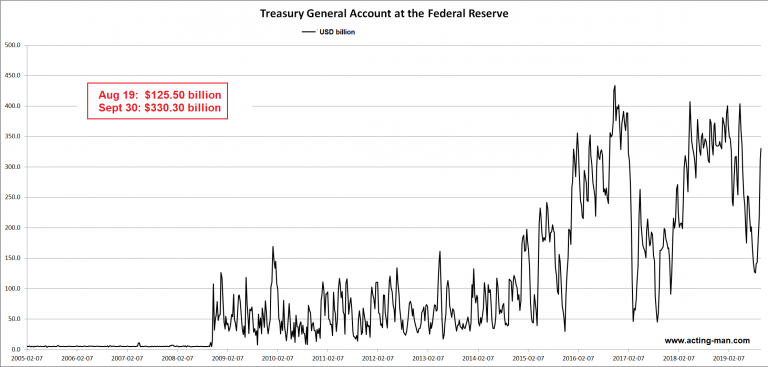
| One factor in the jump in TMS-2 growth in September was the US Treasury’s General Account at the Fed. The Treasury is evidently rebuilding its deposits at the Fed since the most recent “debt ceiling” was removed.
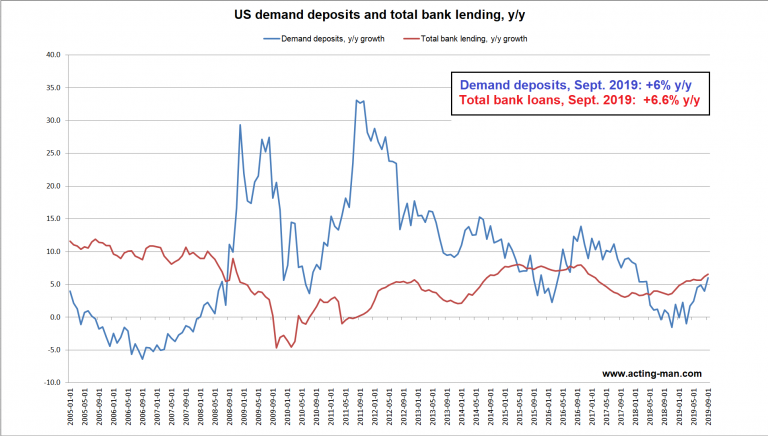
Normally one would expect this to be neutral in terms of TMS-2 growth, as demand deposits of buyers of treasury debt should decrease commensurately. However, after bottoming at minus 1.0% y/y in March, system-wide demand deposit growth has actually accelerated to 6.6% y/y in September. |
US Treasury’s general account at the Fed(see more posts on U.S. Treasury, )The US Treasury’s general account at the Fed: after reaching a low of ~$125 billion in mid August, it has grown to ~$330 billion by the end of September. |
| Rebuilding the Treasury’s cash hoard will usually lead to a temporary liquidity drought. As we have previously discussed, the cash build-up beginning in August was quite likely one of the factors contributing to the recent repo market inconvenience.
Nevertheless, as the recent pace of demand deposit growth indicates, the effect is mitigated by accelerating bank credit growth and the fact that the Fed is expanding its balance sheet again. |
US demand deposits and total bank lending, y/y 2005-2019As of September, growth in demand deposits and total bank lending has accelerated to 6% y/y and 6.6% y/y, respectively. |
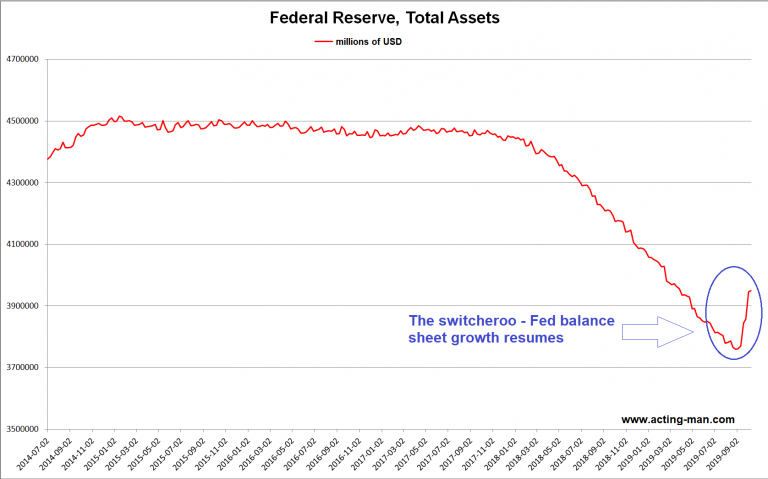
| As an aside to this, the Fed’s balance sheet is actually expanding since July. In other words, the recent announcement of upcoming “reserve management/please don’t call it QE” activities seems to have been in reference to a process that has been underway for some time already. 🙂
|
Federal Reserve, Total Assets, 2014-2019 |
Mind the Lag
As mentioned above, the effects of decelerating and/or accelerating money supply growth on the economy and financial markets tend to arrive with a lag. As this lag is variable, it is not possible to time the arrival of these effects with precision. Moreover, the demand for money plays a role in the context of asset valuations as well.
As the long-term chart of TMS-2 growth above indicates, multi-year lows in y/y money supply growth rates have preceded the last two recessions and the associated bear markets. While the downturns played out, money supply growth was actually re-accelerating, as the Fed intervened. A rebound in economic activity and asset prices followed with a lag.
At present, the stock market still trades close to its highs and credit markets are seemingly placid. And yet, the first cracks are actually beginning to show up in certain areas of the credit markets. We will post an update on recent developments in this market segment shortly.
Charts by acting-man.com, data by St. Louis Fed
Full story here Are you the author? Previous post See more for Next postTags: central-banks,newsletter,On Economy,U.S. Treasury


