


Bitcoin – An Exceptional AssetWhen I first heard about Bitcoin (BTC) in May 2011, it was trading at 8 US dollars. Today, more than eight years later, BTC trades at around 8,000 dollars. A thousandfold increase! An investment of 1,000 dollars at the time would have resulted in a gain of more than a million – a dream result. However, even an exceptional asset such as Bitcoin has its ups and downs – inter alia in terms of its seasonal patterns. And an exceptional seasonal trend lies directly ahead. |
 Bitcoin went from 10,000 BTC for a pizza to around 100 BTC for a Lambo in what appeared to be an unseemly hurry… PT |
The Precise Annual Seasonal Pattern of BitcoinLet us take a close look at the seasonal pattern of Bitcoin. The chart below shows the typical price pattern of Bitcoin in the course of a calendar year. The horizontal axis denotes the time of the year, the vertical axis the level of the seasonal index.
As the chart shows, there is typically an autumn rally in Bitcoin, similar to the one in the stock market. It begins on October 11 and ends on January 05 of the next year. Optimal Seasonal Timing in BitcoinThe average price gain achieved between October 11 and January 05 amounted to 78.83 percent. This is equivalent to an extremely large annualized gain of 1,080.82 percent. |
BTC Seasonal Pattern, 2019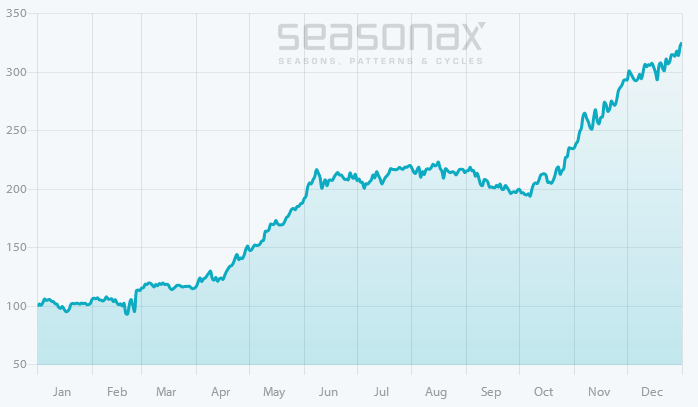 Bitcoin, annual seasonal pattern calculated over 9 years. A strong seasonal rally begins on October 11 - Click to enlarge |
Bitcoin Rallied in 7 out of 9 CasesWhat happened in individual years? The following bar chart shows the return generated by Bitcoin between October 11 and January 05 in every year since 2010. Blue bars show years in which positive returns were achieved, red bars show years that generated negative returns. |
BTC pattern individual years, 2010-2019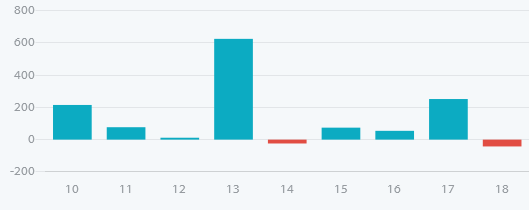 Bitcoin, return in percent between October 11 and January 05 in individual years since 2010. Gains of up to 600% have been seen. - Click to enlarge |
| Blue bars obviously predominate. In this strong seasonal phase of just 86 days price gains of more than 200% were achieved on three occasions. One one these occasions – between October 11 2013 and January 05 2014 – a gain of legendary proportions was recorded. Bitcoin advanced by 624.30%!
Please note: nevertheless, I personally refrain from buying Bitcoin. I also do not consider Bitcoin to be money as defined by monetary theory, as it is neither a commodity nor circulation credit. I rather regard Bitcoin as a kind of lottery ticket in a pyramid scheme. You are of course welcome to hold a different opinion, but I felt I should take this opportunity to inform readers of my stance. |
BTC weekly, 2012-2019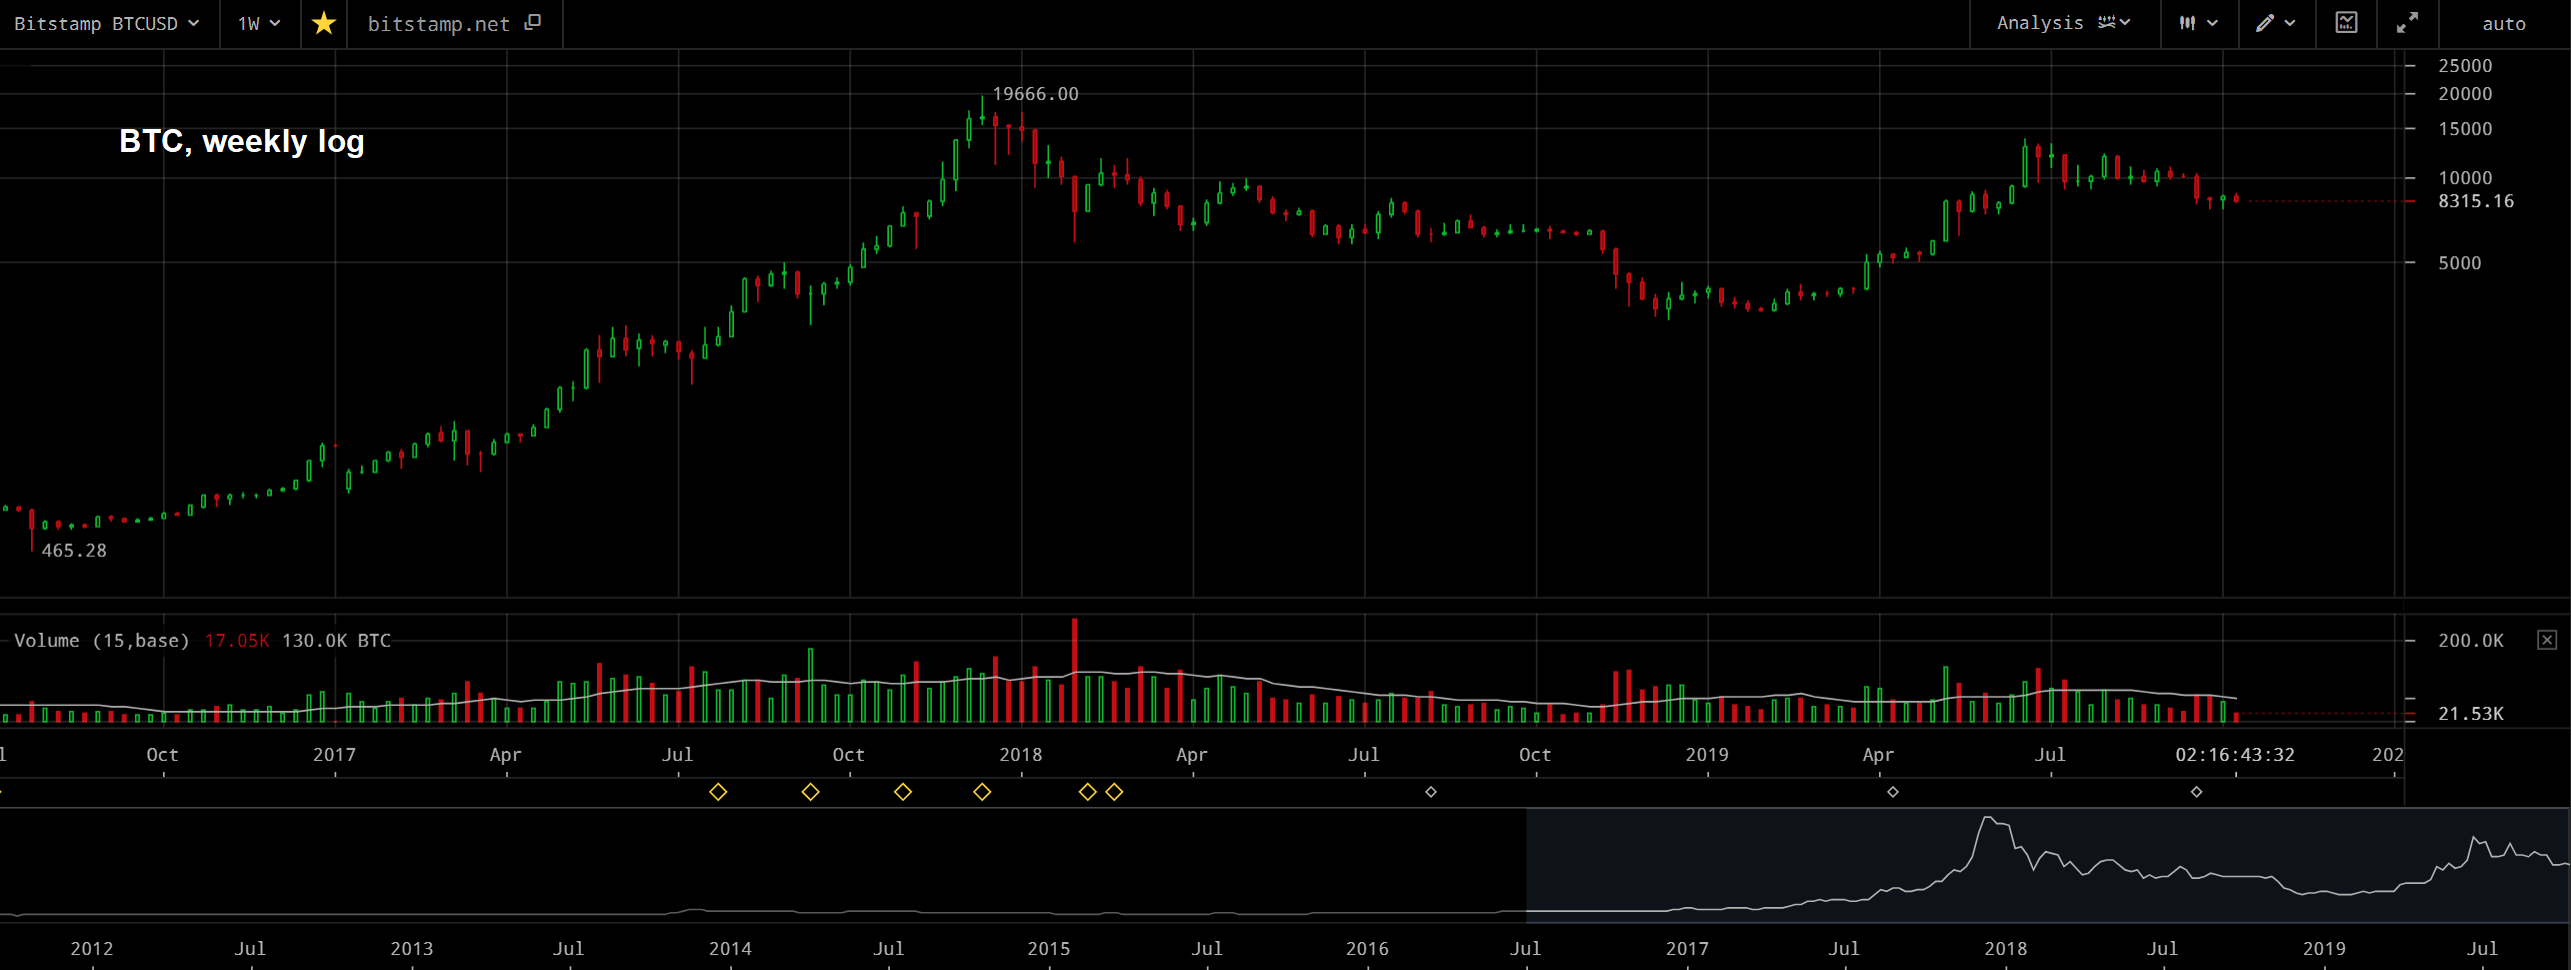 - Click to enlarge BTC weekly since 2014 – also for the record: our view of Bitcoin is somewhat more benign than Dimitri’s – in fact, we do believe it has all the characteristics of money, even though it is not a generally accepted medium of exchange at the current juncture (as we have previously discussed, we consider it to be a secondary medium of exchange). PT |
Check Out Seasonal Patterns of Other Instruments as well!
Regardless of this, there are thousands of other tradable instruments, such as indexes, commodities, bonds, currencies and other cryptocurrencies, all of which you can quickly examine with respect to their seasonality thanks to Seasonax. You can either make use of the web-based app at www.app.seasonax.com or the Seasonax app at Bloomberg and Refinitiv/Thomsom Reuters Eikon – trials for testing the app are also available.
PS: Seasonal patterns can help you as well!
Full story here Are you the author?Tags: Crypto - Currencies,newsletter


