Charles Hugh Smith
My articles My offerMy siteAbout meMy videosMy books
Follow on:TwitterFacebookYoutubeAmazon
Now look at the middle quintiles–the middle class: their income has gone nowhere in the past decade.
These two charts of average incomes of U.S. households by quintile (bottom 20%, middle 60% (20%+20%+20%) and top 20%) have both good news and bad news. (Charts are from the non-partisan Congressional Budget Office — CBO).
These charts depict 1) household income before transfers (means-tested government benefits) and taxes, in other words, pre-tax earned income, income from capital gains and interest, unemployment insurance, etc., and 2) income after federal transfers and taxes.
This is a much more accurate view of household income, as this is what gets deposited in households’ accounts.
The typical chart of average incomes doesn’t include government transfers, so it under-reports the actual income of households receiving means-tested government benefits. (Note that the CBO methodology may not include all government transfers, as not all transfers are means-tested, i.e. based on income and other qualifying factors.)
The CBO reports periodically on the Distribution of Household Income and Federal Taxes, but it doesn’t generate these charts every year. (Go to Congressional Budget Office reports and scroll down to Distribution of Household Income and Federal Taxes).
| Here’s the CBO’s summary of what the charts depict: Means-tested transfers and federal taxes cause household incomes to be more evenly distributed. Those transfers and taxes:Increased income among households in the lowest quintile by $12,000 (or more than 60 percent), on average, to $31,000.Decreased income among households in the highest quintile by $74,000 (or more than 25 percent), on average, to $207,000.While the gap between $31,000 and $207,000 is the core issue in rising income inequality, taxes and means-tested programs do make a big difference:a 60% gain in household income is significant.As for the top 20%, this income is heavily skewed by the top 0.1%, those earning millions or tens of millions of dollars annually. A more accurate look can be found here:Summary of the Latest Federal Income Tax Data, 2018 Update. Note that the charts depict cumulative income growth as percentages, with zero being set in 1979. |
CBO Income Before, 1980 - 2018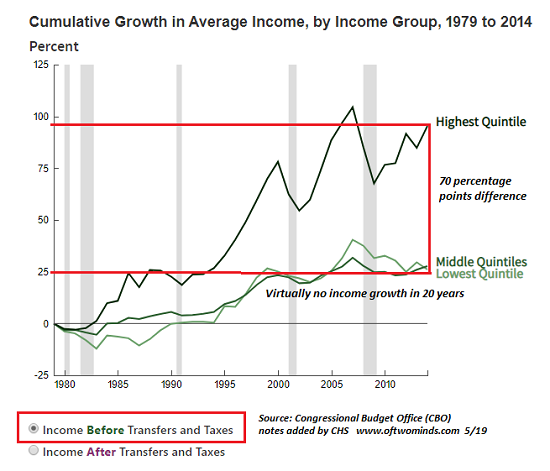 - Click to enlarge |
CBO Income After, 1980 - 2019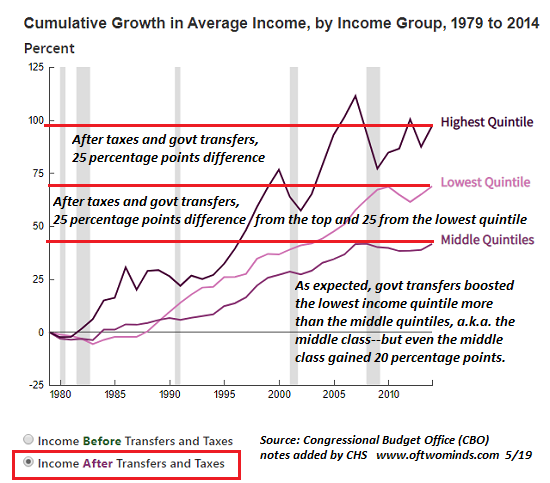 - Click to enlarge |
Let’s call this the good news: yes, income inequality is soaring, but America’s progressive tax system (the wealthy pay higher rates) and government programs transfer income from the top households to the bottom households–pretty much in line with the political mandate of the majority of Americans.
The bad news is the middle class has received no real income gains in the past 20 years, and they don’t qualify for many means-tested transfers. I’ve marked the charts up to highlight this.
In the income before transfers and taxes chart, the lowest and the middle quintiles are about where they were in 1999. Both gained ground in the 2005-08 housing bubble, but as with all bubbles, the effects only lasted as along as the bubble itself.
Since the top quintile’s income accelerated away from the bottom 80% in the early 1990s, there is a 70 percentage point gap between the top 20% and the bottom 80%. I’ve addressed the reasons for soaring income-wealth inequality here many times, but the key takeaway is the enormous gains reaped by the top 20% during asset bubbles, which are the consequence of financialization and central bank-fueled speculation.
In the income after transfers and taxes chart, the gap between lowest and top quintiles drops from 70 to 25 percentage points: a big reduction. After transfers, the lowest quintile income has gained steadily since the late 1980s. If we eliminate the asset bubble peaks, the gap between the top and bottom quintiles hasn’t grown that much.
Now look at the middle quintiles–the middle class: their income has gone nowhere in the past decade. Both the top and bottom quintiles have notched percentage gains in income while middle class income has stagnated.
And there you have it: financialization, central bank-fueled speculation and globalization greatly boosted the incomes of the top 20%, while government transfers have significantly increased the incomes of the bottom 20% of households.
The middle 60%, who did not benefit from the credit-fueled orgies of speculative bubbles (financialization) or globalization, and who do not qualify for many means tested transfers, have experienced near-zero income growth in the past decade of “recovery” and soaring asset bubbles.
We all know this from real-life experience in America: it pays to be either wealthy or low-income (especially if the household getting means-tested benefits also works in the black-market informal economy for cash). As for the middle 60%: you get nothing.
My new book is The Adventures of the Consulting Philosopher: The Disappearance of Drake. For more, please visit the book's website.


Full story here
Are you the author?
At readers' request, I've prepared a biography. I am not confident this is the right length or has the desired information; the whole project veers uncomfortably close to PR. On the other hand, who wants to read a boring bio? I am reminded of the "Peanuts" comic character Lucy, who once issued this terse biographical summary: "A man was born, he lived, he died." All undoubtedly true, but somewhat lacking in narrative.
Tags: newsletter