


Joseph Y. Calhoun
My articles My siteAbout meMy videosMy books
Follow on:LinkedINTwitterSeeking AlphaAmazon
The economic data reported over the last month managed to confirm both that the economy is slowing and that there seems little reason to fear recession at this point. The slowdown is mostly a manufacturing affair – and some of that is actually a fracking slowdown – but consumption has also slowed. On a more positive note, housing seems to have found its footing with lower rates and employment is still fairly robust. The US economic growth rate in this cycle has been disappointing and the forces that have made that so haven’t changed. The short burst of higher growth last year has faded – as we expected – and in the short term I don’t see much reason to expect another burst. There are, however, some positive signs about the future that ought not be overlooked.
Economic ReportsEconomic Growth & InvestmentIndustrial production managed to eke out a positive for the month but mostly due to a 3.7% rise in utility output. Manufacturing was down with business equipment off a full 1%. Mining output – fracking – was up but just 0.3%. Personal income was up just 0.2% but the 4.2% yoy change is pretty stable for this cycle. We’ve had better growth rates in past cycles but this is pretty normal for this one. Consumer spending was up just 0.1% on the month which kept the savings rate at a fairly high level. The savings rate has been in an uptrend for some time now – a result of weak consumption this cycle – and that is one of those key long term positives I spoke about in the opening paragraph. |
Economic Growth & Investment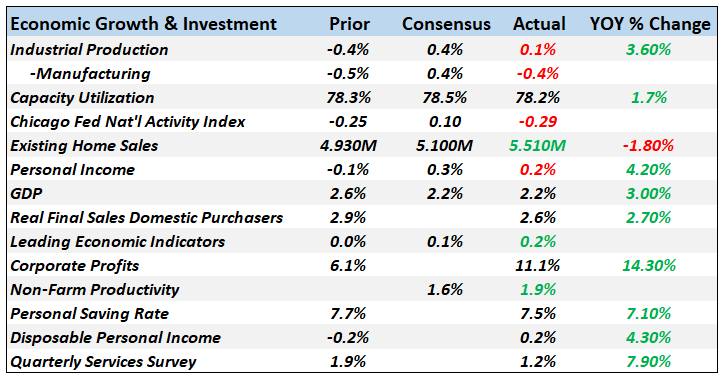 - Click to enlarge |
| The CFNAI, one of our favorite indicators, was negative again last month and the important 3 month average is now-0.18. That merely confirms what we already know – the economy is growing below trend right now. But that is to be expected if the economy is going to slow back to the previous growth rate around 2%. The recession warning for the CFNAI is -0.75 so we aren’t there yet. |
Personal Income 1965-2015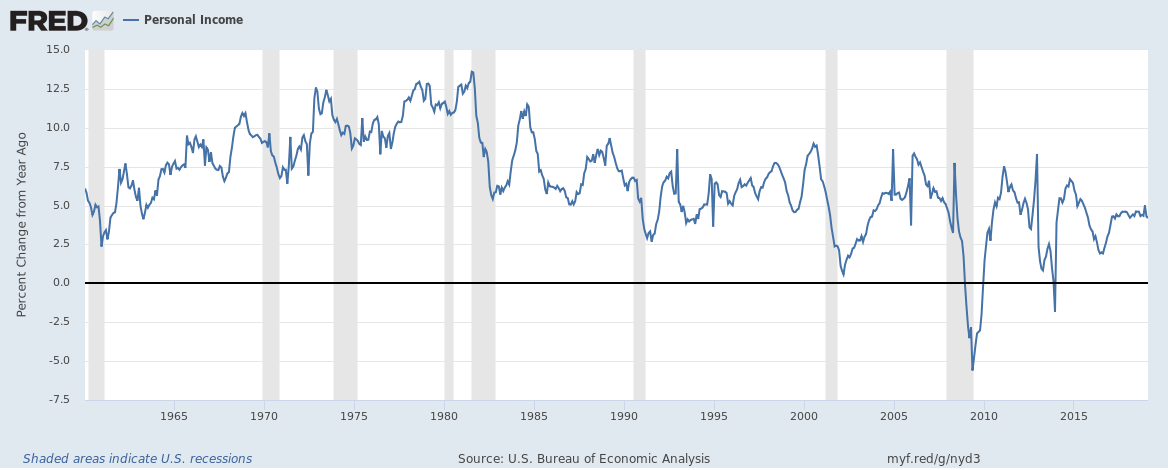 - Click to enlarge |
| Ultimately, economic growth depends on two things: workforce growth and productivity growth. Both have been weak in the US recently – productivity growth has been weak since the turn of the century – and that graphically illustrates our weak growth in recent times. Why exactly both of these factors are not as robust as they once were is a matter of great debate and I don’t want to get into that argument but suffice it to say that until we change one of those variables, we aren’t going to change our growth outlook. And what really matters is productivity because that is how we change individual living standards. |
Personal Consumption Expenditures 1965-2015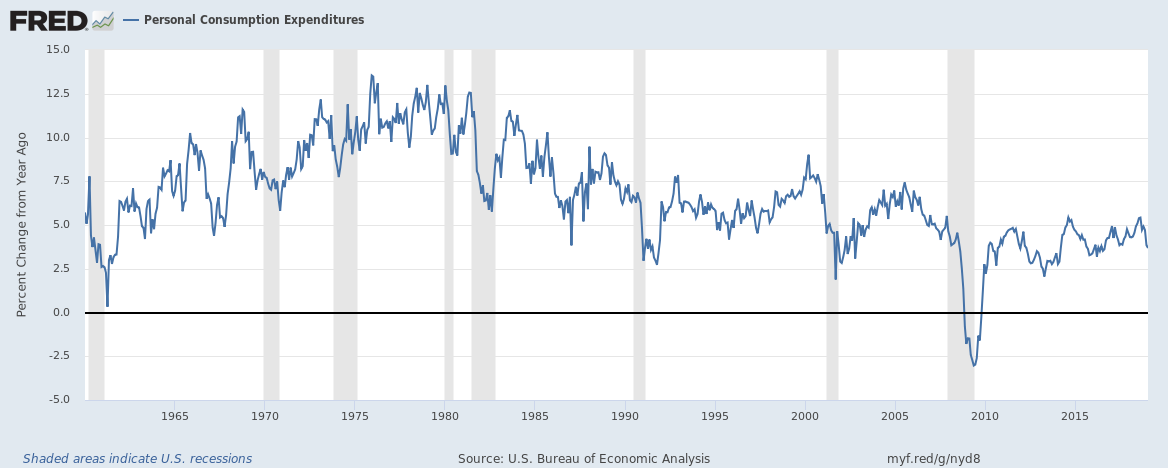 - Click to enlarge |
| Raising productivity requires investment and investment requires savings. So the rise in the savings rate to 7.5%, while still less than what we’ve seen historically, is good news long term even if it limits consumption and growth in the short term. There is a lot more to increasing productivity than just the personal savings rate – government and corporate savings obviously play a role too – but it is very important and trending in the right direction. |
Personal Saving Rate, 1960-2015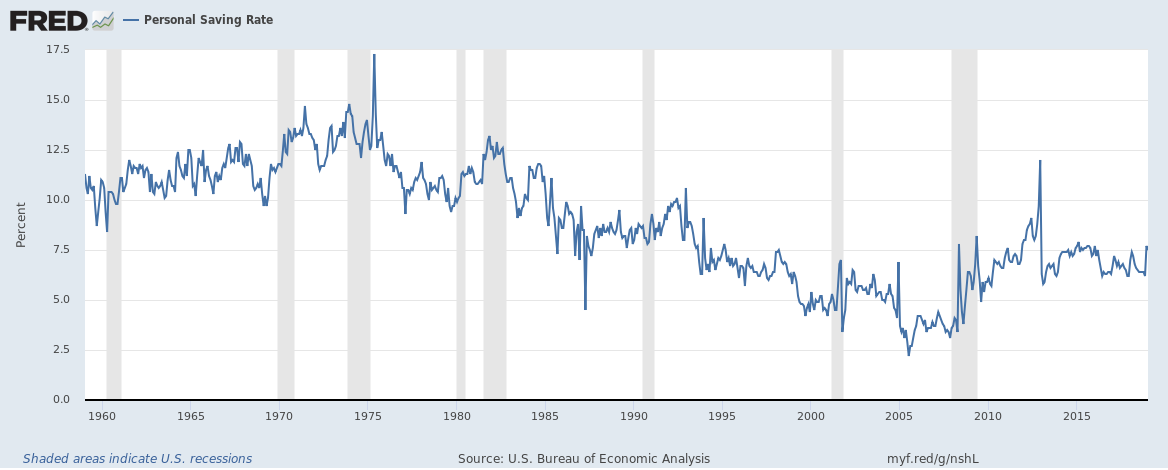 - Click to enlarge |
ProductionAs might be expected in a slowing economy, these sentiment measures are mixed. As I’ve written many times in the past, these surveys are very coincident so they don’t tell us much about the future. The present may be slowing but these readings are not recessionary. |
Production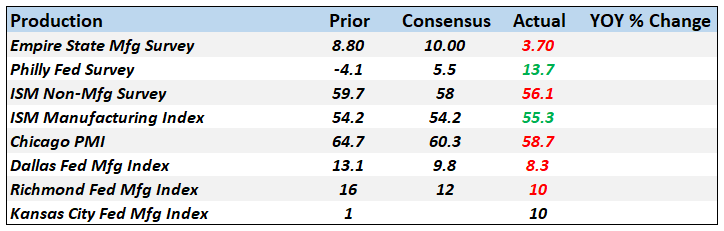 - Click to enlarge |
Consumption & DistributionRetail sales growth is slowing but consumption is a lagging indicator so it doesn’t tell us much about the future. The recent slowdown appears to be nothing more than a response to recession fears. If recession fears fade, retail sales will likely rebound some. |
Consumption & Distribution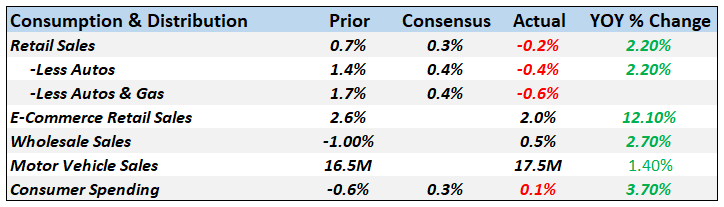 - Click to enlarge |
Advance Retail Sales 1994-2018 - Click to enlarge |
|
InventoriesThe slowdown in consumption does not appear to have been anticipated by business. Inventories are rising at both the wholesale and retail levels and relative to sales. The inventory to sales ratio is still less than the peak in 2016 but the trend is worrisome. |
Inventories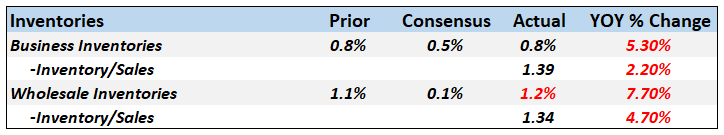 - Click to enlarge |
Total Business: Inventories to Sales Ratio, 1994-2018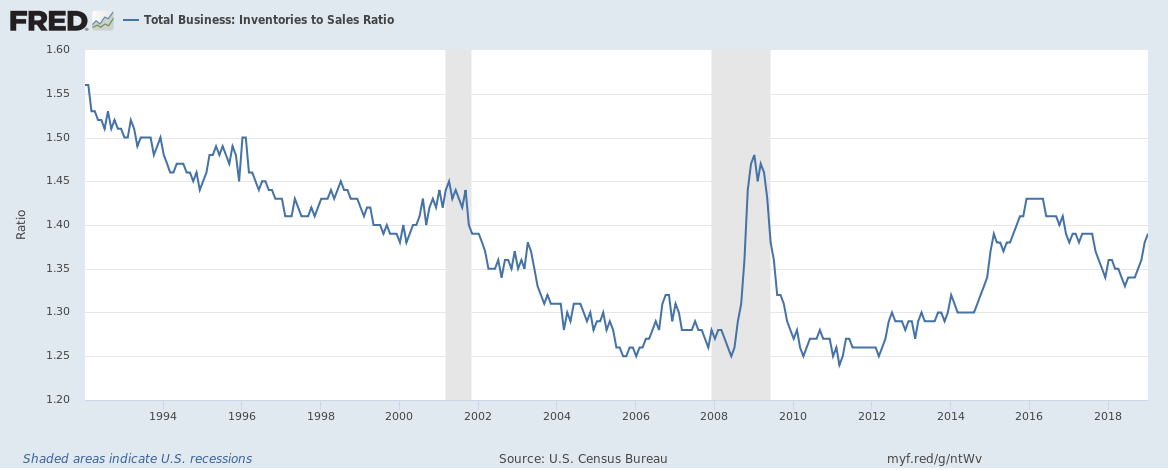 - Click to enlarge |
|
OrdersDurable goods orders were down on the month due to a slowing in aircraft orders – I’m guessing that the Boeing sales department is struggling a bit right now – but the ex-transportation number wasn’t much better. Core capital goods orders were disappointing, down 0.1%. I’ve shown this chart many times but I do because it doesn’t seem to get any better. Core capital goods orders for the US economy are barely higher today than 2000 and less than the last peak in April of 2008. That tells you a lot about why our growth has been punk for over a decade. |
Orders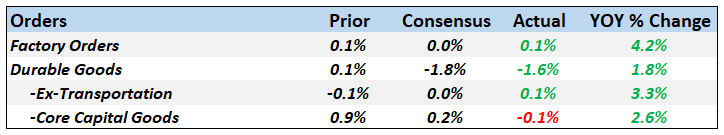 - Click to enlarge |
Manufacturers' New Orders, 1994-2018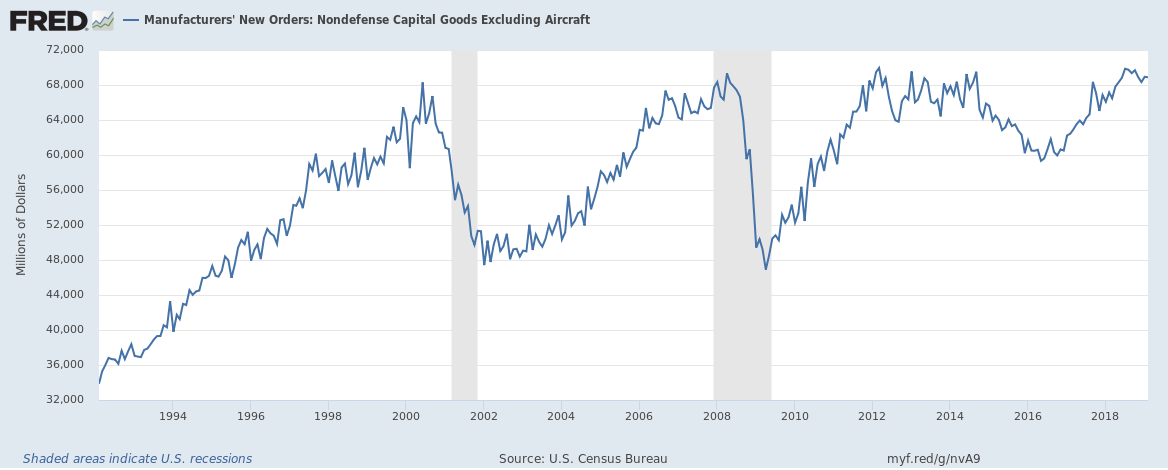 - Click to enlarge |
|
TradeUS weakness is reflected in a 2.6% drop in imports. |
Trade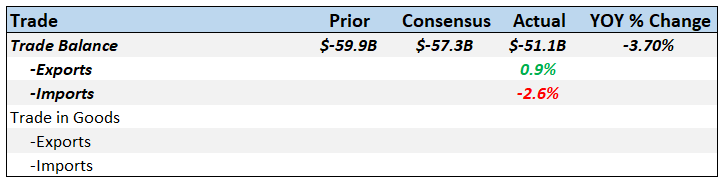 - Click to enlarge |
InflationThe official measures of inflation are still benign and housing inflation continues to wane. But I don’t expect either of those to continue. More on housing below. |
Inflation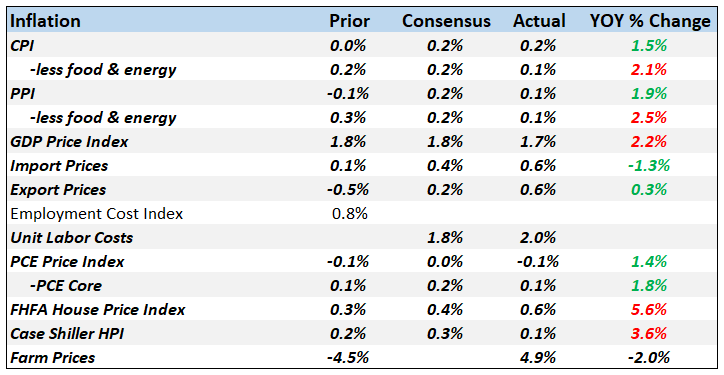 - Click to enlarge |
EmploymentThe employment picture remains fairly robust with job openings and quits at new highs. Hiring has been less robust this year but is still positive. Jobless claims hit a low last seen in 1969 last week but I have some doubts about how positive those numbers actually are. With the rise of the gig economy – or the 1099ization of the US economy as I like to call it – how many people are actually eligible for unemployment benefits? I don’t know the full answer but I’m pretty sure that number has gone down. Is there an opening here for private unemployment insurance? |
Employment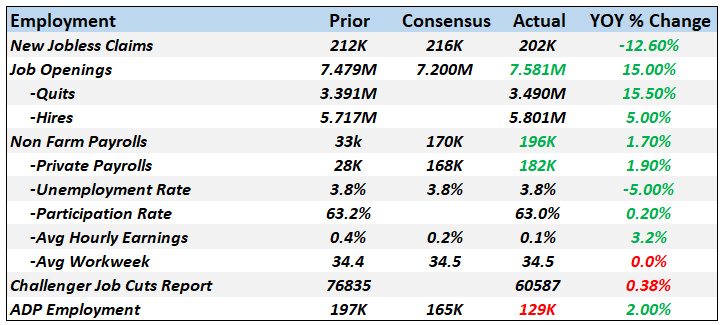 - Click to enlarge |
Job Openings: Total Nonfarm, 2002-2018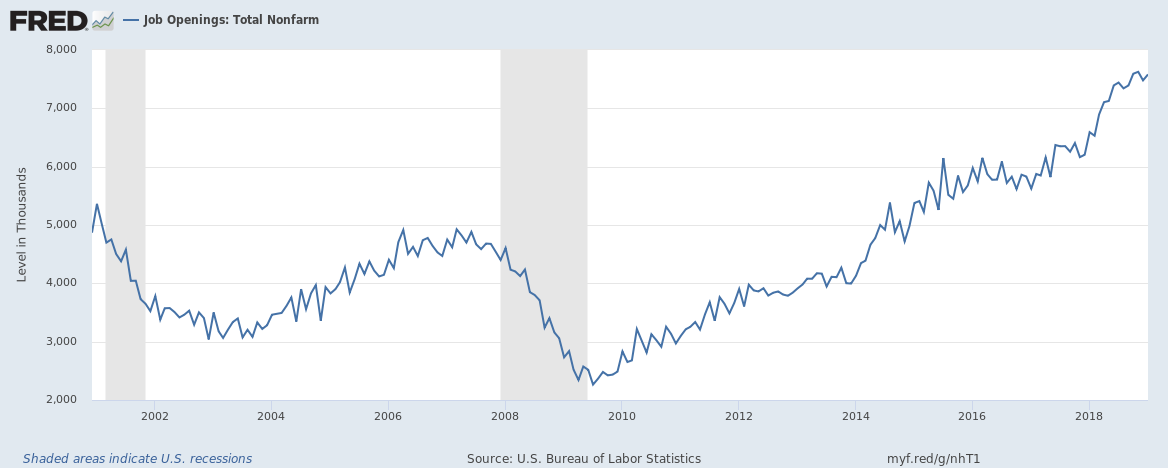 - Click to enlarge |
|
Quits: Total Nonfarm, 2002-2018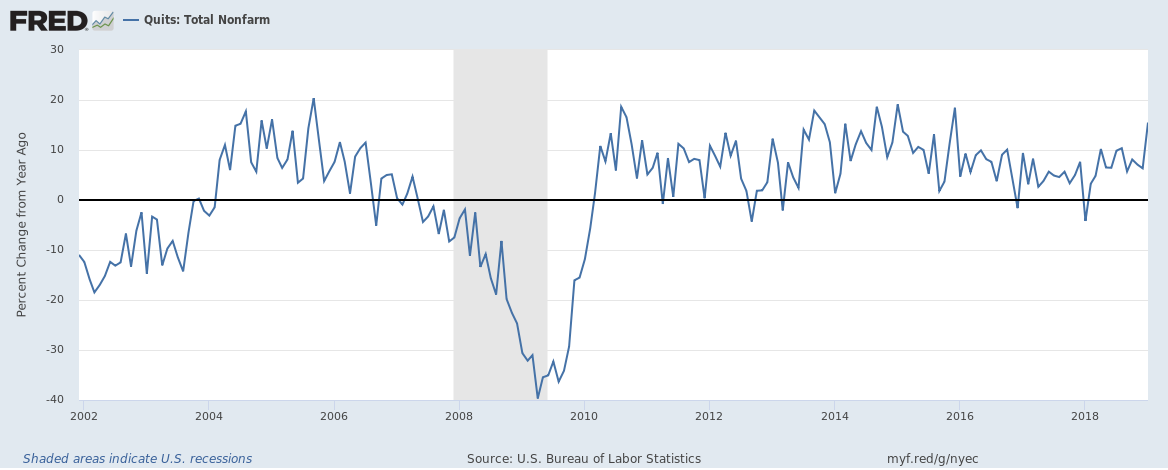 - Click to enlarge |
|
ConstructionHousing starts have recovered some recently but were still a little less than expected and down almost 10% year over year. But new home sales may have bottomed and construction spending has been improving recently. Much of the increase in construction spending is on public construction such as roads, highways and education but that seems almost inevitable. And I would not expect a slowdown in public spending as the 2020 campaign heats up. |
Construction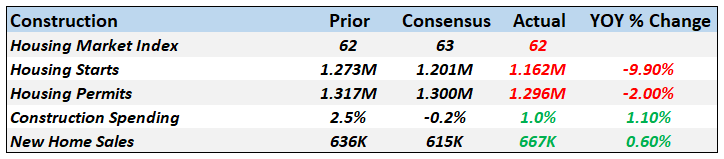 - Click to enlarge |
| What is more interesting to me is the long term picture for housing. Population growth of just over 2 million was the lowest last year since the mid-1970s but housing starts are running at just over half of that. That is not sustainable obviously unless we are going to cram more people into ever smaller and smaller spaces. That might be the only solution for places like NYC and San Francisco (due to rent control) but not for most of the rest of the country. We are either going to build more housing or prices and rents are going up – a lot. Probably some of both. |
New One Family Houses Sold: United States, 1965-2015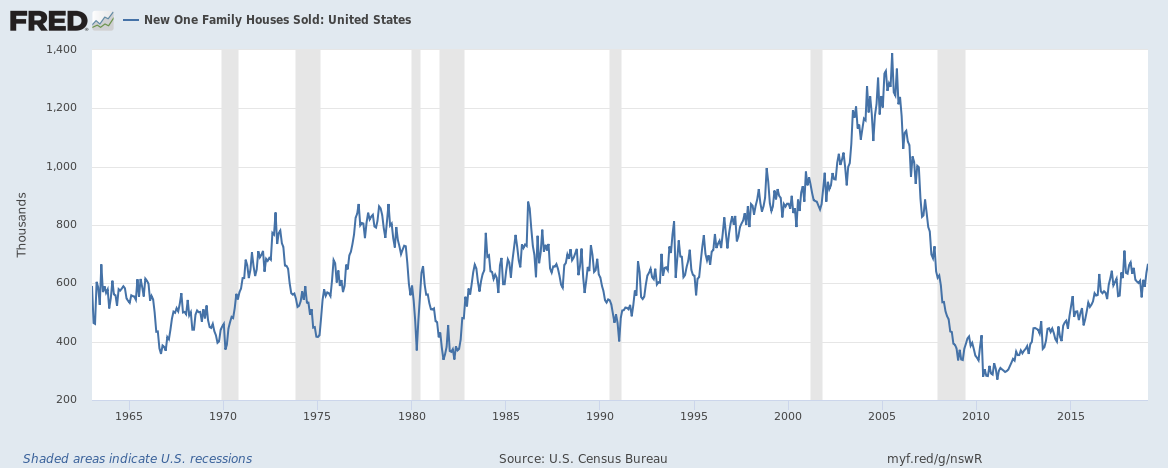 - Click to enlarge |
Population, 1965-2015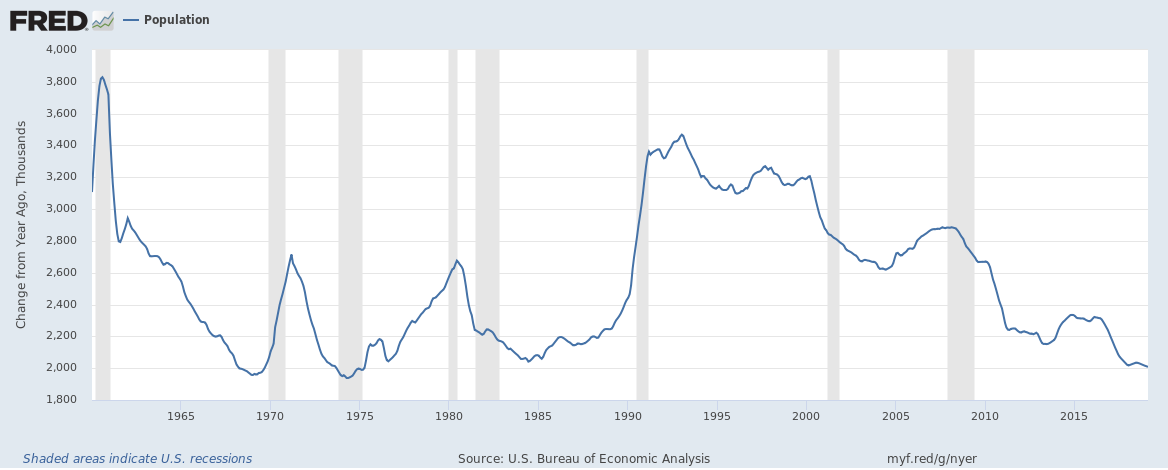 - Click to enlarge |
|
Housing Starts 1960-2015 - Click to enlarge |
|
SentimentSentiment and confidence have fallen back some from their peaks but there are no obvious warning signs here. |
Other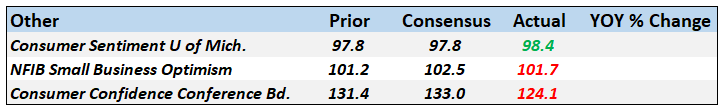 - Click to enlarge |
InternationalWith many things in life, it is the rate of change that matters the most and economic data is no different. What happens at the margin is what moves markets. In this case, one interesting observation recently is that revisions to German data are running very positive. In many cases the revisions are from negative to positive and of course no one writes articles about such things since it isn’t “news” anymore. Except it is and quite important I think. China’s data rate of change also seems to be turning positive. Overall, it seems the ex-US part of the global slowdown may be starting to come to an end. The economic data paints a mixed picture of the US economy, some obvious negatives and some not so obvious positives. For now, I don’t see anything in the data other than a growth rate cycle slowdown. Those happen frequently in an expansion and this is certainly not the first of this cycle. Most of these do not turn into recession but they do make us more vulnerable to a negative shock. And with this administration a negative shock is just a tweet away. |
International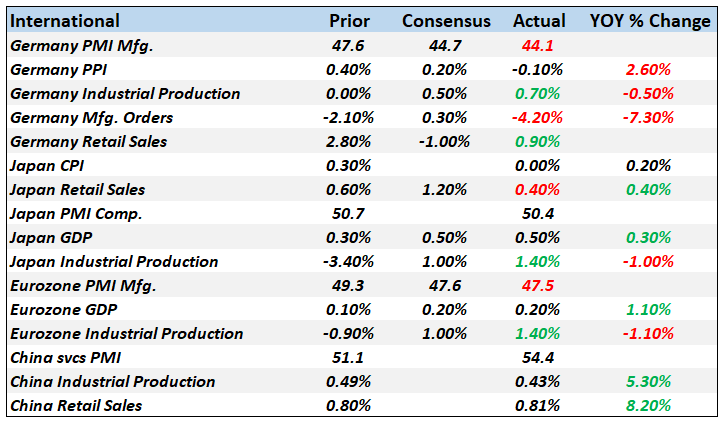 - Click to enlarge |
Tags: Alhambra Research,capital goods,cfnai,consumption,economic growth,economy,employment,Housing,inflation,Inventories,investment,Markets,Monthly Macro Monitor,newsletter,Personal Income,productivity


