As more and more data rolls in even in this delayed fashion, the more what happened to end last year makes sense. The Census Bureau updated today its statistics for US trade in November 2018. Heading into the crucial month of December, these new figures suggest a big setback in the global economy that is almost certainly the reason markets became so chaotic.
After all, money dealers don’t need this kind of statistical data like we do. They sit in between real economy participants, and though it may not be a complete picture they do get a sense of what’s actually happening in the real economy in real-time. I wrote last month:
And if banks are already scaling back their eurodollar involvement to then find how it is having an effect on both Sweden and Japan, it isn’t surprising to learn they’d cut back on pretty much everything in between (and maybe do so at great speed, focusing squarely on the exits above all else). This would include purely financial transactions, so-called hot money, otherwise having less or little to do with the real economy transactions of trade.
That’s especially true if the one giving off weak signals for banks in the middle is China rather than just Sweden or Japan. If that one goes into reverse, the pullback from it can become much more generalized. Sweden goes sour, get out of Sweden; China goes sour, get out of everything.
| If China is sour because US demand for Chinese goods might be disappearing, all the worse.
Especially in the context of globally synchronized growth. For many, this was an abrupt difference; real economy and effective eurodollar participants could tell the economy of 2017 and early 2018 wasn’t really robust, yet it was the promise of how that was just the first step toward a real boom. First synchronized growth, then boom. |
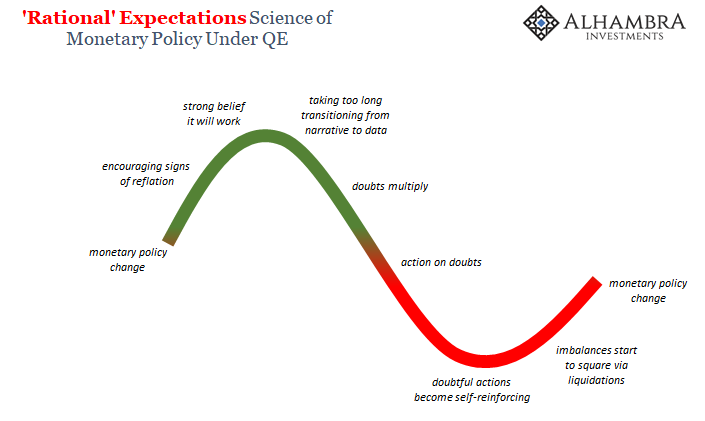
Rational Expectations |
| Instead, the more the year dragged on the more it became clear a real boom was increasingly unlikely. Then October, when it seems as if “unlikely” was downgraded even further. The economic estimates for November and some of the foreign numbers for December make for very real concerns about the economy not in some distant future probability, but right now at this very moment.
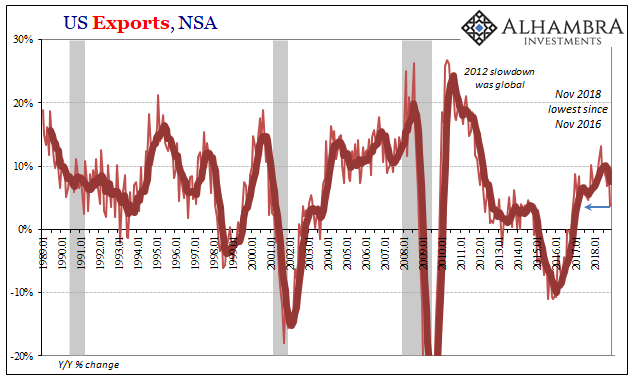
In a very short period of time, expectations went from somewhat plausibly imminent boom to possibly imminent global recession. US exports rose just 3.7% year-over-year in November 2018 according to the latest Census estimates. That’s the weakest for outbound trade since November 2016, around the time Reflation #3 started. Imports gained just 3.0% year-over-year, the lowest since February 2017. |
US Exports, NSA 1989-2018 |
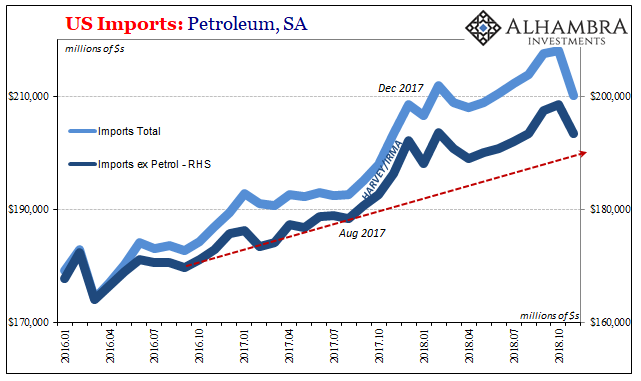
| Seasonally-adjusted, exports were down big in November from October while imports just collapsed. On the inbound side, the crash in crude oil prices is one reason for the decline but not the only one. After rising nearly 27% year-over-year in October, the following month crude imports were down 1.8% year-over-year. |
US Imports, NSA 1989-2018 |
| Excluding petroleum, US imports rose just 3.8% in November, also the lowest since February 2017. That month’s slackening in US demand for foreign goods was particularly broad-based. |
US Trade, SA 2014-2018 |
| Which brings us to China. It is always claimed that China is diversifying internally as well as externally. The country has signed trade agreements with a number of other countries and on the inside the economy is being rebalanced toward domestic consumption. We are told these are intentional acts, proactive policies designed to wean China off particularly US demand for Chinese manufactured goods. |
US Imports: Petroleum, SA 2016-2018 |
| And yet, after so many years hearing all this it remans perfectly clear how Chinese economic fortunes are still tied very closely to those of the United States. If the US isn’t buying what China wants to sell, none of the rest matters.
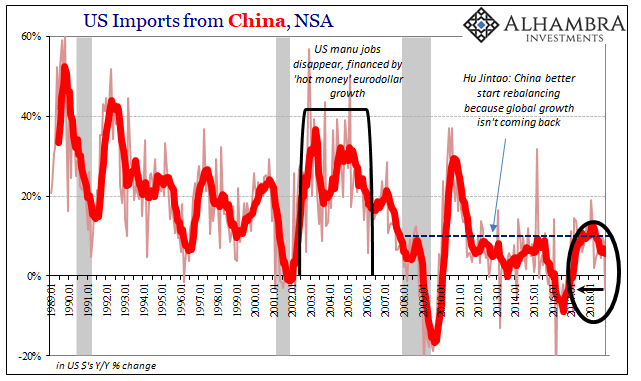
US imports from China fell by 3.3% year-over-year in November. It was the first contraction since February 2017, and the first not related to Golden Week distortions since October 2016. China’s slowing industry in the latter half of last year mirrors the decelerating and now declining US appetite for Chinese products. |
US Imports from China, NSA 1989-2018 |
| Trade wars are certainly playing a negative role, but that’s not the overriding deficiency.US demand for any goods foreign and domestic has been unusually weak for years now, all the way back to 2011, and outside of the brief recovery-like episode in 2010, all the way back to 2007. There were no trade wars in 2007 nor 2011, and certainly not any in the big (for Asia) disruption during 2015.
Global trade and global money go hand in hand, primarily because global money (eurodollars) developed at first for global trade. The monetary system evolved into so much more that ended up encompassing pretty much everything, but at its core the need for financing trade terms remains a central focus. |
US TIC - 6-month, 1996-2018 |
| December is that much clearer now though the data is delayed. The world was supposed to be accelerating and instead China began to stumble in obvious fashion. Despite many maybe the majority still thinking the US was decoupling, it begins to look like the American economy is starting to stumble, too, and that is one big reason for the proliferating negatives across the world.
Markets in December: get out of everything, liquidity risk (inverted curves) has become paramount. It isn’t just about December, though, which is why most markets (outside of stocks) remain closer to December as liquidity preferences continue to dominate. It may be that what happened at the end of last year was a one-off, but it also may have been just the beginning. That latter possibility is surely worth continued hedging. |
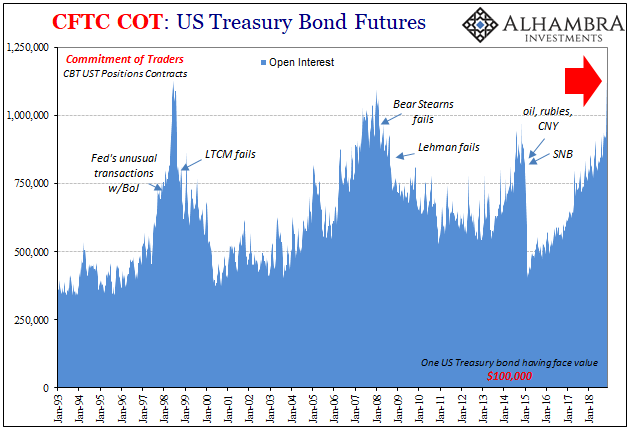
CFTC COT: US Treasury Bond Futures 1993-2018 |
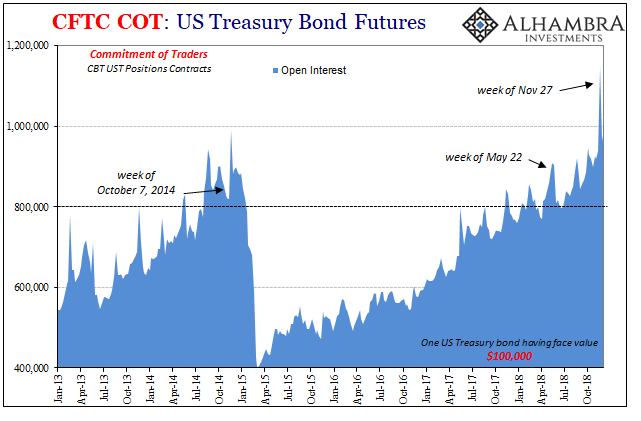
CFTC COT: US Treasury Bond Futures 2013-2018 |
Tags: Bonds,China,currencies,economy,exports,Federal Reserve/Monetary Policy,global trade,imports,Markets,newsletter


