


George Dorgan
My articles My siteAbout meMy videosMy books
Follow on:LinkedINTwitterSeeking Alpha
CFA SocietyEconomicBlogs
We do not like Purchasing Power or Real Effective Exchange Rate (REER) as measurement for currencies. For us, the trade balance decides if a currency is overvalued. Only the trade balance can express productivity gains, while the REER assumes constant productivity in comparison to trade partners.
Who has read Michael Pettis, knows that a rising trade surplus may also be caused by a higher savings rate while the trade partners decided to spend more. This is partially true. Recently Europeans started to increase their savings rate, while Americans reduced it. This has led to a rising trade and current surplus for the Europeans. But also to a massive Swiss trade surplus with the United States, that lifted Switzerland on the U.S. currency manipulation watch list.
To control the trade balance against this “savings effect”, economists may look at imports. When imports are rising at the same pace as GDP or consumption, then there is no such “savings effect”.
After the record trade surpluses, the Swiss economy may have turned around: consumption and imports are finally rising more than in 2015 and early 2016. In March the trade surplus got bigger again, still shy of the records in 2016.
Swiss National Bank wants to keep non-profitable sectors alive
Swiss exports are moving more and more toward higher value sectors: away from watches, jewelry and manufacturing towards chemicals and pharmaceuticals. With currency interventions, the SNB is trying to keep sectors alive, that would not survive without interventions.
At the same time, importers keep the currency gains of imported goods and return little to the consumer. This tendency is accentuated by the SNB, that makes the franc weaker.
Texts and Charts from the Swiss customs data release (translated from French).
Exports and Imports YoY DevelopmentIn October 2018, seasonally adjusted exports grew 6.0%, after their slightly negative evolution since June. They thus reach a level monthly record. Conversely, the decline in imports continued (-1.8%). The balance commercial loop with a surplus of 2.6 billion francs. In short |
Swiss exports and imports, seasonally adjusted (in bn CHF), October 2018(see more posts on Switzerland Exports, Switzerland Imports, ) Source: newsd.admin.ch - Click to enlarge |
Overall EvolutionAfter having recorded a slight negative trend in previous months, seasonally adjusted exports jumped 6.0% (real: + 6.3%) in October 2018. They thus amounted to 18.9 billion francs, establishing a record monthly level. Imports fell 1.8% (real: -3.6%), continuing the negative trend that began in mid-2018. The surplus in the trade balance reached 2637 million francs. |
Switzerland Trade Balance, October 2018(see more posts on Switzerland Trade Balance, )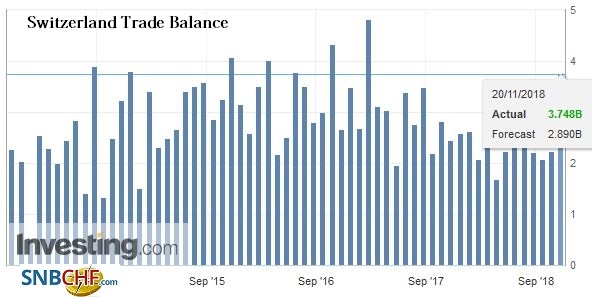 Source: investing.com - Click to enlarge |
ExportsChemistry-pharma, growth engine with an increase of 937 million francs Chemicals and pharmaceuticals accounted for almost 90% (or 937 million francs) of export growth. While the three pharma segments saw their turnover increase by between 15% and 30%, drugs weighed heavily in nominal terms, with a rise of 778 million francs. Note that the brilliant result of October follows three consecutive monthly sharp declines. Watch sales rose 4.2%, but showed a slightly negative trend since July. Precision instruments as well as the machinery and electronics sector stagnated. While the former remain despite their bullish wave of the previous six months, the machinery and electronics sector has been stalled since July. Among the top three markets, Europe (+ 7.6%) and Asia (+ 3.0%) shone while North America (-0.5%) stagnated. After falling in previous months, exports to Europe increased by 774 million francs. This growth was based mainly on the Netherlands (pharma, +217 million francs) and Ireland (+204 million). The Asian rise has relied on many countries. After two negative months, sales to China picked up again (+ 7.0%); to raise also the progress of Saudi Arabia and Singapore. For North America, the stagnation experienced since the beginning of the year continued. |
Swiss Exports per Sector October 2018 vs. 2017(see more posts on Switzerland Exports, Switzerland Exports by Sector, )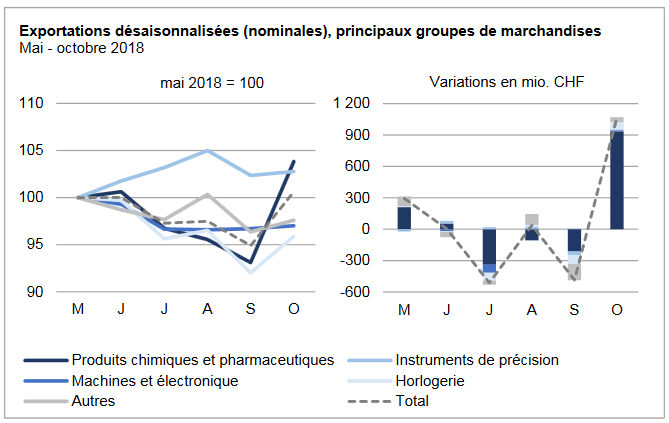 Source: newsd.admin.ch - Click to enlarge |
ImportsNet decline in imports from Canada and the United Arab Emirates The decline in imports was mainly due to the plunging of chemical and pharmaceutical products (- 455 million francs) and more particularly the active ingredients. For the period May to October 2018, the pharmaceutical segment showed a highly disparate and flat trend. Despite a contraction of 35 million francs, the machinery and electronics sector remains on a positive trend. For the first time since June, shipments of metals increased (+39 million). In the other goods group, jewelery entries gained ground (+80 million) but remained one-third lower than their record level set in May 2018. Imports from Europe stagnated over a month while those from Asia and North America fell by 1.6% (-52 million francs) and 10.3% (-132 million francs), respectively. On the North American side, Canada has for several months been witnessing a disparate evolution due to irregular delivery of aircraft. In Asia, the contraction of the United Arab Emirates (-405 million francs, jewelery) contrasted with the rise in China (+136 million) and Japan (+88 million). Overall, imports from Europe show a downward trend: they stagnated in October after three months of decline. Ireland once again showed volatility (-372 million), while France rose by two-fifths (+203 million) and Austria by 89 million francs. |
Swiss Imports per Sector October 2018 vs. 2017(see more posts on Switzerland Imports, Switzerland Imports by Sector, )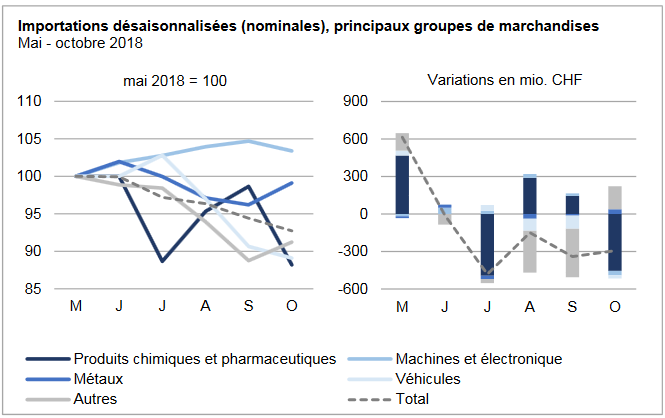 Source: newsd.admin.ch - Click to enlarge |
Full story here Are you the author?
Tags: newsletter,Switzerland Exports,Switzerland Exports by Sector,Switzerland Imports,Switzerland Imports by Sector,Switzerland Trade Balance


1 comments
babu
2018-12-07 at 22:55 (UTC 2) Link to this comment
thanks. I used to read your articles years ago and glad I could find you again. I’m finally ready to start a short CHF basket for the long-term!