


George Dorgan
My articles My siteAbout meMy videosMy books
Follow on:LinkedINTwitterSeeking Alpha
CFA SocietyEconomicBlogs
We do not like Purchasing Power or Real Effective Exchange Rate (REER) as measurement for currencies. For us, the trade balance decides if a currency is overvalued. Only the trade balance can express productivity gains, while the REER assumes constant productivity in comparison to trade partners.
Who has read Michael Pettis, knows that a rising trade surplus may also be caused by a higher savings rate while the trade partners decided to spend more. This is partially true.
Recently Europeans started to increase their savings rate, while Americans reduced it. This has led to a rising trade and current surplus for the Europeans.
But also to a massive Swiss trade surplus with the United States, that lifted Switzerland on the U.S. currency manipulation watch list.
To control the trade balance against this “savings effect”, economists may look at imports. When imports are rising at the same pace as GDP or consumption, then there is no such “savings effect”.
After the record trade surpluses, the Swiss economy may have turned around: consumption and imports are finally rising more than in 2015 and early 2016. In March the trade surplus got bigger again, still shy of the records in 2016.
Swiss National Bank wants to keep non-profitable sectors alive
Swiss exports are moving more and more toward higher value sectors: away from watches, jewelry and manufacturing towards chemicals and pharmaceuticals. With currency interventions, the SNB is trying to keep sectors alive, that would not survive without interventions.
At the same time, importers keep the currency gains of imported goods and return little to the consumer. This tendency is accentuated by the SNB, that makes the franc weaker.
Texts and Charts from the Swiss customs data release (translated from French).
Exports and Imports YoY DevelopmentAfter a year and a half of continued growth in Swiss foreign trade, exports in the third quarter of 2018 contracted by 2.9% compared with the previous quarter’s record. However, they remained above the 54 billion franc mark. Evolving at a high level, imports fell by 1.5% (-768 million francs). The trade balance closes with a surplus of 3.5 billion francs. ▼ Pharma-Chemistry and Jewelery Lead Exports and Imports |
Swiss exports and imports, seasonally adjusted (in bn CHF), Q3 2018(see more posts on Switzerland Exports, Switzerland Imports, )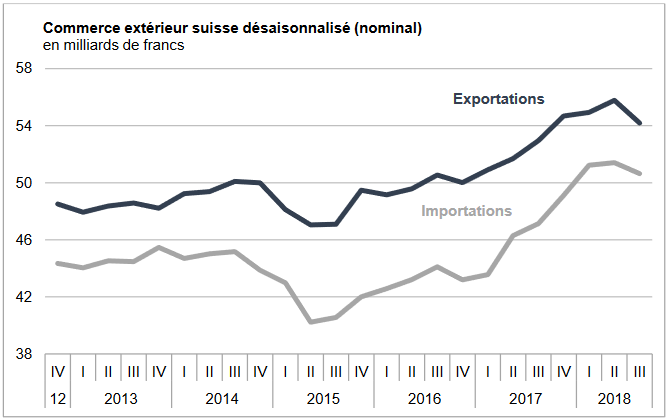 Source: Swiss Customs - Click to enlarge |
Overall EvolutionAfter having increased in the last six quarters, seasonally adjusted exports fell by 2.9% in the third quarter of 2018 (real: -2.3%) compared to the record of the second. However, they continued to move above the 54 billion franc mark, which is at a very high level. Imports showed a strong dynamism from the beginning of 2017 until the first quarter of 2018. They then fell, to a high level however (3rd quarter 2018: -1.5% or -2.0% respectively). in real terms). The surplus in the trade balance from July to September 2018 amounts to 3547 million francs. |
Switzerland Trade Balance, September 2018(see more posts on Switzerland Trade Balance, )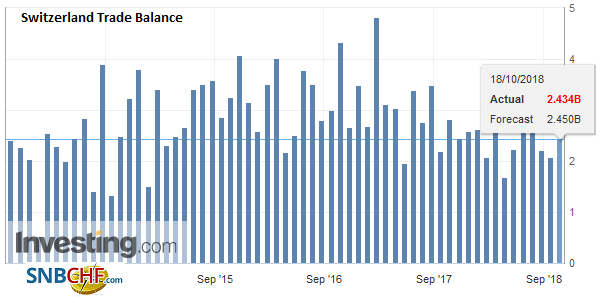 Source: Investing.com - Click to enlarge |
ExportsPrecision instruments continue their momentumWith the exception of precision instruments (+ 1.5%), which show an upward trend since the beginning of 2017 to reach a record high, all major commodity groups turned red in the third quarter of 2018 The biggest drop was in watch exports (-5.2%), which had their first setback since January 2017. In nominal terms, however, it was the exports of chemicals and pharmaceuticals that were hit the hardest with a fall. CHF 1.0 billion (-3.9%). In chemistry-pharmaceuticals, sales of immunological products plunged 9.3% (-694 million francs) compared to the previous quarter. In the machinery and electronics sector, the 2.4% decline also put an end to uninterrupted growth that began in early 2017. Explaining 88% of the overall decline, Europe fell by 4.3% after six quarters of dynamism. Turnover with France (-406 million francs, mainly jewelery) contracted by a tenth, confirming the volatility of recent quarters. Austria and the Netherlands also fell in the same proportions. After several quarters of growth, Asia also came to a halt (-0.8%). Here, the United Arab Emirates, South Korea and Japan weighed on the result. The Japanese partner has also recorded its third consecutive decline. China, for its part, shone; exports to the Middle Kingdom have strengthened over the past four quarters, setting a historic peak. Sales to North America (USA: + 1.0% and Canada: + 11.3%) strengthened. Since the middle of 2015, the US has shown an impressive uptrend to reach a record level in the third quarter of 2018. |
Swiss Exports per Sector, Q3 2018 vs. Q3 2017(see more posts on Switzerland Exports, Switzerland Exports by Sector, )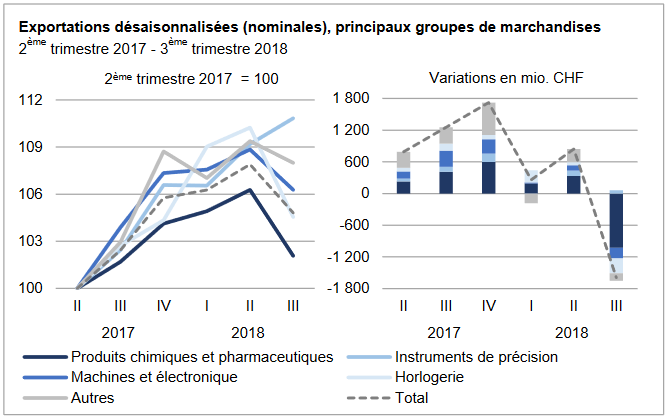 Exports by commodity group: Nominal changes adjusted for working days compared with Q3 2017 Source: Swiss Customs - Click to enlarge |
ImportsImports from the United Arab Emirates sixteen times in two yearsThree of the five main import sectors recorded red figures during the third quarter of 2018. The largest contraction affected the other goods group, notably jewelery (-10.6% or -495 million francs). which reveals a highly disparate evolution since mid-2017. Imports of chemicals and pharmaceuticals fell by 203 million francs (active ingredients: -606 million). After changing in a heterogeneous way, this sector has fallen back to its level of a year ago. Like the previous quarter, shipments of metals contracted (-100 million). Conversely, vehicles (airliners) and the machinery and electronics sector (+293 million) posted an increase. The latter also has a positive trend since early 2017. With the exception of North America (USA: + 6.6% and Canada: + 9.1%), imports from the other two main suppliers declined in the third quarter of 2018. Europe fell by 3.5% (-1.3 billion francs), the first of the last six quarters. Ireland and France (-315 and -189 million) sealed the result, as did Germany (-206 million, -1.5%). On the Asian side (-4.1%), Singapore and China, in particular, fell, even if these two partners show a long-term upward trend. Inflows from the United Arab Emirates, on the other hand, rose by two-fifths (+731 million, jewelery). Over the last two years, this partner has seen its shipments grow by sixteen, becoming the second largest Swiss supplier in Asia. |
Swiss Imports per Sector, Q3 2018 vs. Q3 2017(see more posts on Switzerland Imports, Switzerland Imports by Sector, )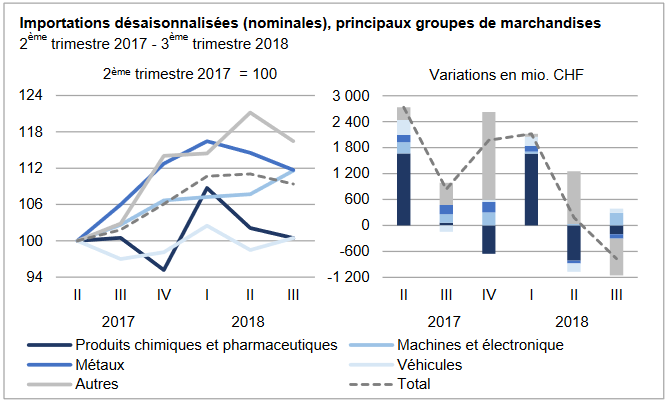 Imports by commodity group: Nominal changes adjusted for working days compared with Q3 2017 Source: Swiss Customs - Click to enlarge |
Full story here Are you the author?
Tags: newsletter,Switzerland Exports,Switzerland Exports by Sector,Switzerland Imports,Switzerland Imports by Sector,Switzerland Trade Balance


