With the first half of 2018 now drawn to a close, much of the financial medias’ headlines and commentary relating to the gold market has been focusing on the fact that the US dollar gold price has moved lower year-to-date. Specifically, from a US dollar price of $1302.50 at close on 31 December 2017, the price of gold in US dollar terms has slipped by approximately 3.8% over the last six months to around $1252.50, a drop of US $50.
Since the world’s major gold price discovery hubs of London and New York trade gold in US dollars (or more correctly predominantly trade synthetic gold and derivatives), and since much of the mainstream financial media tends to be very US-centric, the media’s fixation with the US dollar price of gold is probably not surprising. However, it’s not the full story, because in some major national currencies as well as in cryptocurrencies, the price of gold has actually moved higher year-to-date.
From the perspective of an investment bank forex trading desk, where gold is traded as a currency in ‘pairs trades’ against a set of major fiat currencies, the varied movements of gold prices across a range of currencies will not be surprising. Currency prices (including the price of gold) are constantly moving against one another, creating these exchange rates. What’s important to these forex traders is the ‘relative strength‘ of currencies and of gold (and increasingly of cryptocurrencies).
| Since the US dollar has had a relatively strong performance year-to-date 2018 against many other fiat currencies, this means on the flip side that many national currencies have weakened vis-a-vis the US dollar. By definition, this also means that the gold price performance year-to-date, measured in any currency which has weakened more in percentage terms against the US dollar than the US dollar gold price has weakened, will actually now be higher in those currencies.
For those with a base currency other than US dollars, or whose wealth or earning power is denominated in currencies other than US dollars, it’s important to keep track of the relative strength / weakness of one’s base currency, and at the same time look beyond the financial media’s headlines, and keep an eye on the gold price in that base currency / home currency. |
|
Brazilian RealLet’s look at some examples. Some of the worst relative performances of fiat currencies over the first 6 months of this year have been the Brazilian Real, the Swedish Krona, the Russian Rouble, the South African Rand, and the Indian Rupee, i.e. a mix of developed and emerging market currencies, and a mix of commodity and non-commodity currencies. Given the very strong performances of cryptocurrencies late last year (especially in December 2017), and their subsequent price reversals since January, the gold price when measured in cryptocurrencies, such as Bitcoin, is also higher over the first half of 2018. Year-to-date, the Brazilian Real (BRL) has lost more than 17% of its value against the US dollar. However, over the same time, the price of gold in Brazilian Real has gone up by more than 12.5%, rising from BRL 4315 per troy ounce at the start of January to BRL 4858 per ounce at the end of June. The explanation for this is as follows. At the start of 2018, the US dollar gold price was trading at US $1302.50 per troy ounce, which at the USD / BRL exchange rate of USD 1 = BRL 3.31 at that time translated into BRL 4315 per troy ounce of gold. Fast forward six months and the US dollar gold price ended June $50 lower at US$ 1252.50 per ounce. |
Gold Price in Brazilian Real, January – June 2018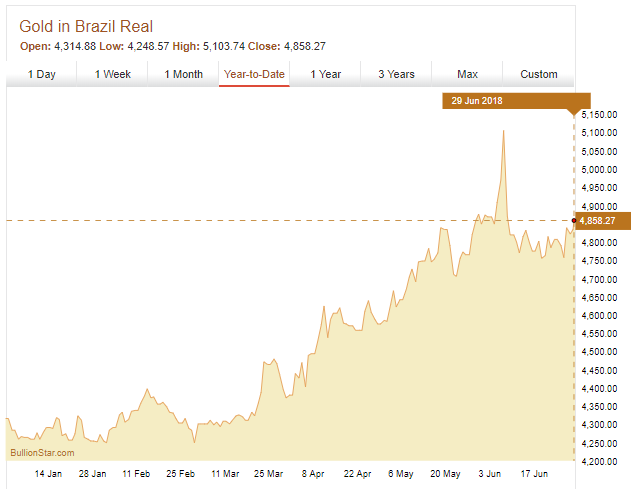 - Click to enlarge |
| Over the same 6 month time period, the Brazilian Real weakened against the US dollar, falling from 1 dollar = BRL 3.31 at the start of January to 1 dollar = BRL 3.88 at the end of June. In Brazilian Real terms, that end of June gold price of US$ 1252.50 per ounce price now translates into BRL 4858 (1252.5 * 3.88). In this case, the rise in the local currency (BRL) price of gold is attributable to the fall in the value of the Brazilian Real. This is a classic example of the gold price adjusting to reflect the weakness in a local currency. |
Brazilian Real per US Dollar, January – June 2018.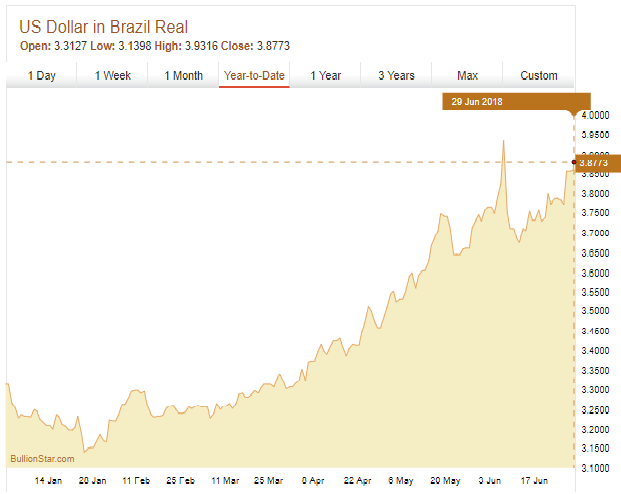 - Click to enlarge |
Swedish KronaTaking another example, year-to-date, the Swedish Krona has also had a relatively poor performance, falling by more than 11.5% against the US dollar over the first 6 months of 2018. However, during the same time period, the gold price in Swedish Krona has rallied strongly from SEK 10685 per troy ounce to approximately SEK 11210 per troy ounce. |
Gold Price in Swedish Krona, H1 2018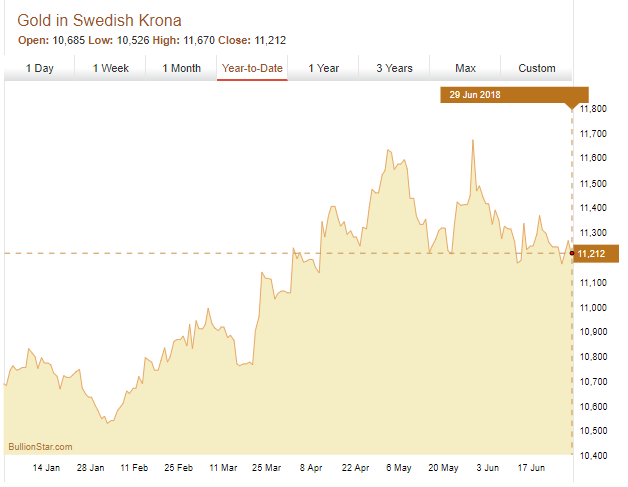 - Click to enlarge |
| Again, even though the US dollar gold price fell from US$ 1302.50 to US$ 1252.50 during the first half of 2018, the SEK gold price has risen. Why? Because the Swedish Krona has weakened from 1 USD = SEK 8.023 at the start of January to 1 USD = SEK 8.950 at the end of June, meaning that the US$ 1252.50 gold price now translates into SEK 11,210 (1252.50 * 8.95). |
Swedish Krona per US Dollar, January – June 2018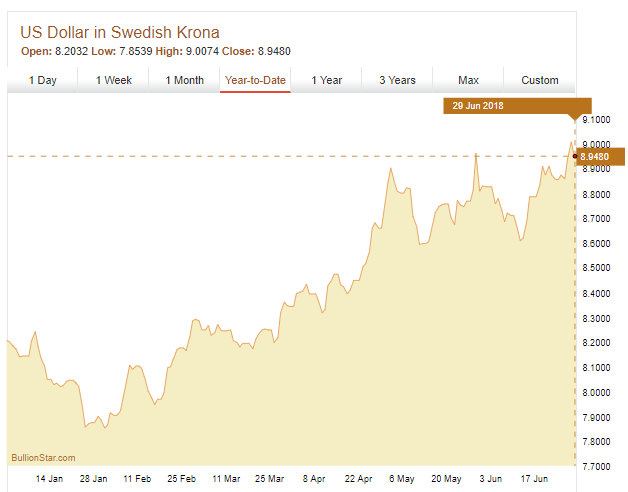 - Click to enlarge |
Russian RoubleDuring the year-to-date to end of June 2018, the gold price in Russian Rouble (RUB) has risen from RUB 75110 per troy ounce to RUB 78690, an increase of approximately 4.75%. Over this time, the value of the Rouble has fallen from approximately 1 USD = 57.7 RUB at the start of January to 1 USD = 62.8. Again this means that even though the US dollar price of gold has ebbed from US$ 1302.5 to US$ 1252.2 over the first 6 months of 2018, the RUB value of an ounce of gold has increased on the back of the depreciating RUB exchange rate (1302.50 * 62.8). |
Gold Price in Russian Rouble, H1 2018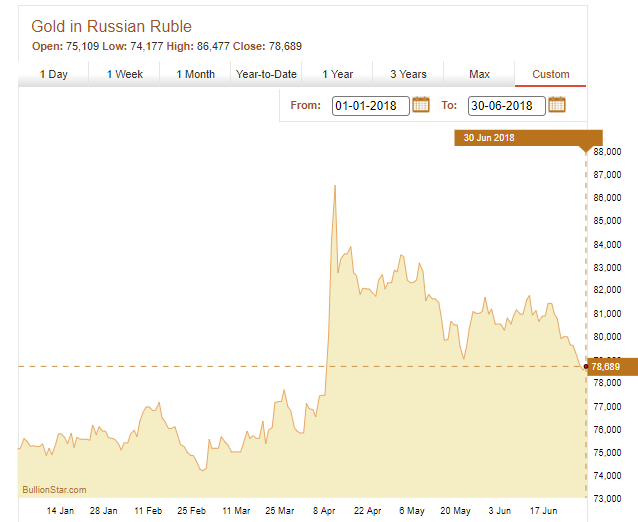 - Click to enlarge |
Indian RupeeThe story is similar in Indian Rupee. Over the year-to-date 2018, the gold price in Indian Rupee (INR) has risen 3.19% in local currency terms, from INR 83130 per troy ounce to approximately INR 85780 per troy ounce. In this case, over the first half of 2018, the US dollar strengthened from 1 USD = 63.85 INR to 1 USD = 68.45, with the higher Rupee gold price reflecting the US dollar gold price of 1252.50 translated into Rupee at a 68.45 to 1 exchange rate. |
Gold Price in Swedish Krona, H1 2018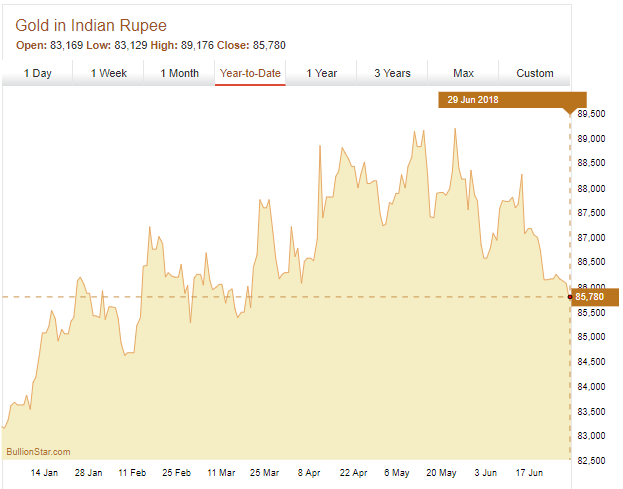 - Click to enlarge |
BitcoinThe upward price movements of the gold price denominated in Bitcoin are even more startling. From an opening price of approximately US$ 14,110 on 1st January 2018, the price of Bitcoin in US dollars fell dramatically over the first 6 months of the year, to around US$ 6400, i.e. a 55% drop in 6 months. However, the gold price denominated in Bitcoin more than doubled over the same time frame, rising from 0.09 to 0.20 for the year-to-date. This would mean, for example, that had you traded out of Bitcoin and into gold at the start of 2018, your Bitcoin at that time would have had more than twice as much purchasing power in terms of purchasing gold as it had at the end of June. |
Gold Price in Bitcoin, January – June 2018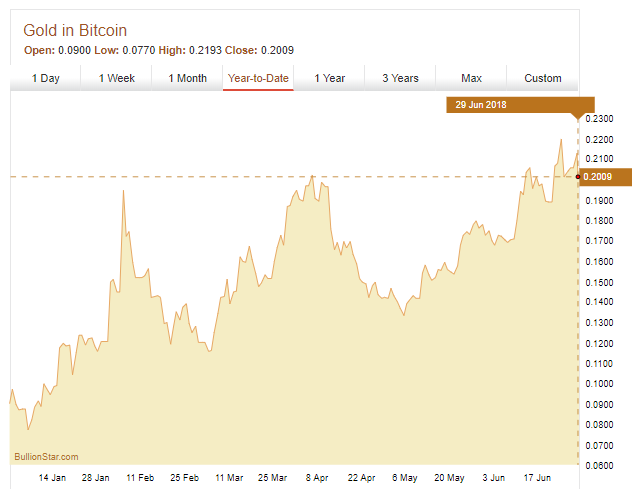 - Click to enlarge |
A Better Way of ThinkingGiven the constant fluctuations in fiat currencies, fixating on the gold price in US dollars, or indeed in any fiat currency, may not be the best way to think about your gold holdings. After all, many savers and investors in physical gold move their wealth and investments into physical gold precisely because it is not linked to fiat currencies and is a gateway out of government induced financial repression. Remember that physical gold has no counterparty risk, and is not issued by any central bank, government or monetary authority. Physical gold is mined tangible asset with inherent value and a limited supply. A better way to think about an investment or holding in gold is perhaps by how much of it your hold. For example, I had US$ 13,000, which I used to buy ten 1 troy ounce gold Maple Leaf coins. Whatever happens with the gyrations of fiat currencies, I still have those 10 gold maple Leafs and I can think of my holdings of physical gold as 10 gold Maple Leafs, weighing a combined 10 troy ounces. Savers and investors move into physical gold precisely because it’s a monetary store of value that maintains its purchasing power over time and as such offers an exit from the debasement of fiat currencies such as the US dollar. Buying physical gold and then constantly trying to value it in terms of a fiat base currency is in some ways illogical. Surely a more logical approach is to say, I had x amount of dollars, but now I own X ounces of gold. The same applies to gold’s role as a safe haven and form of financial insurance, i.e. physical gold is a form of wealth preservation in times of monetary and economic crisis. People make an allocation and use the safe harbor of physical gold precisely because it is ring-fenced from the turmoil of fiat currencies and associated central bank and government meddling. Again, surely a better way of thinking would be to say, I had x amount of fiat currency, I used this to buy gold, and now I have X ounces or X kilograms of gold. At a minimum, thinking in this way is a liberation from the constant barrage of mainstream, media commentary about the US dollar gold price, which can only be a good thing. |
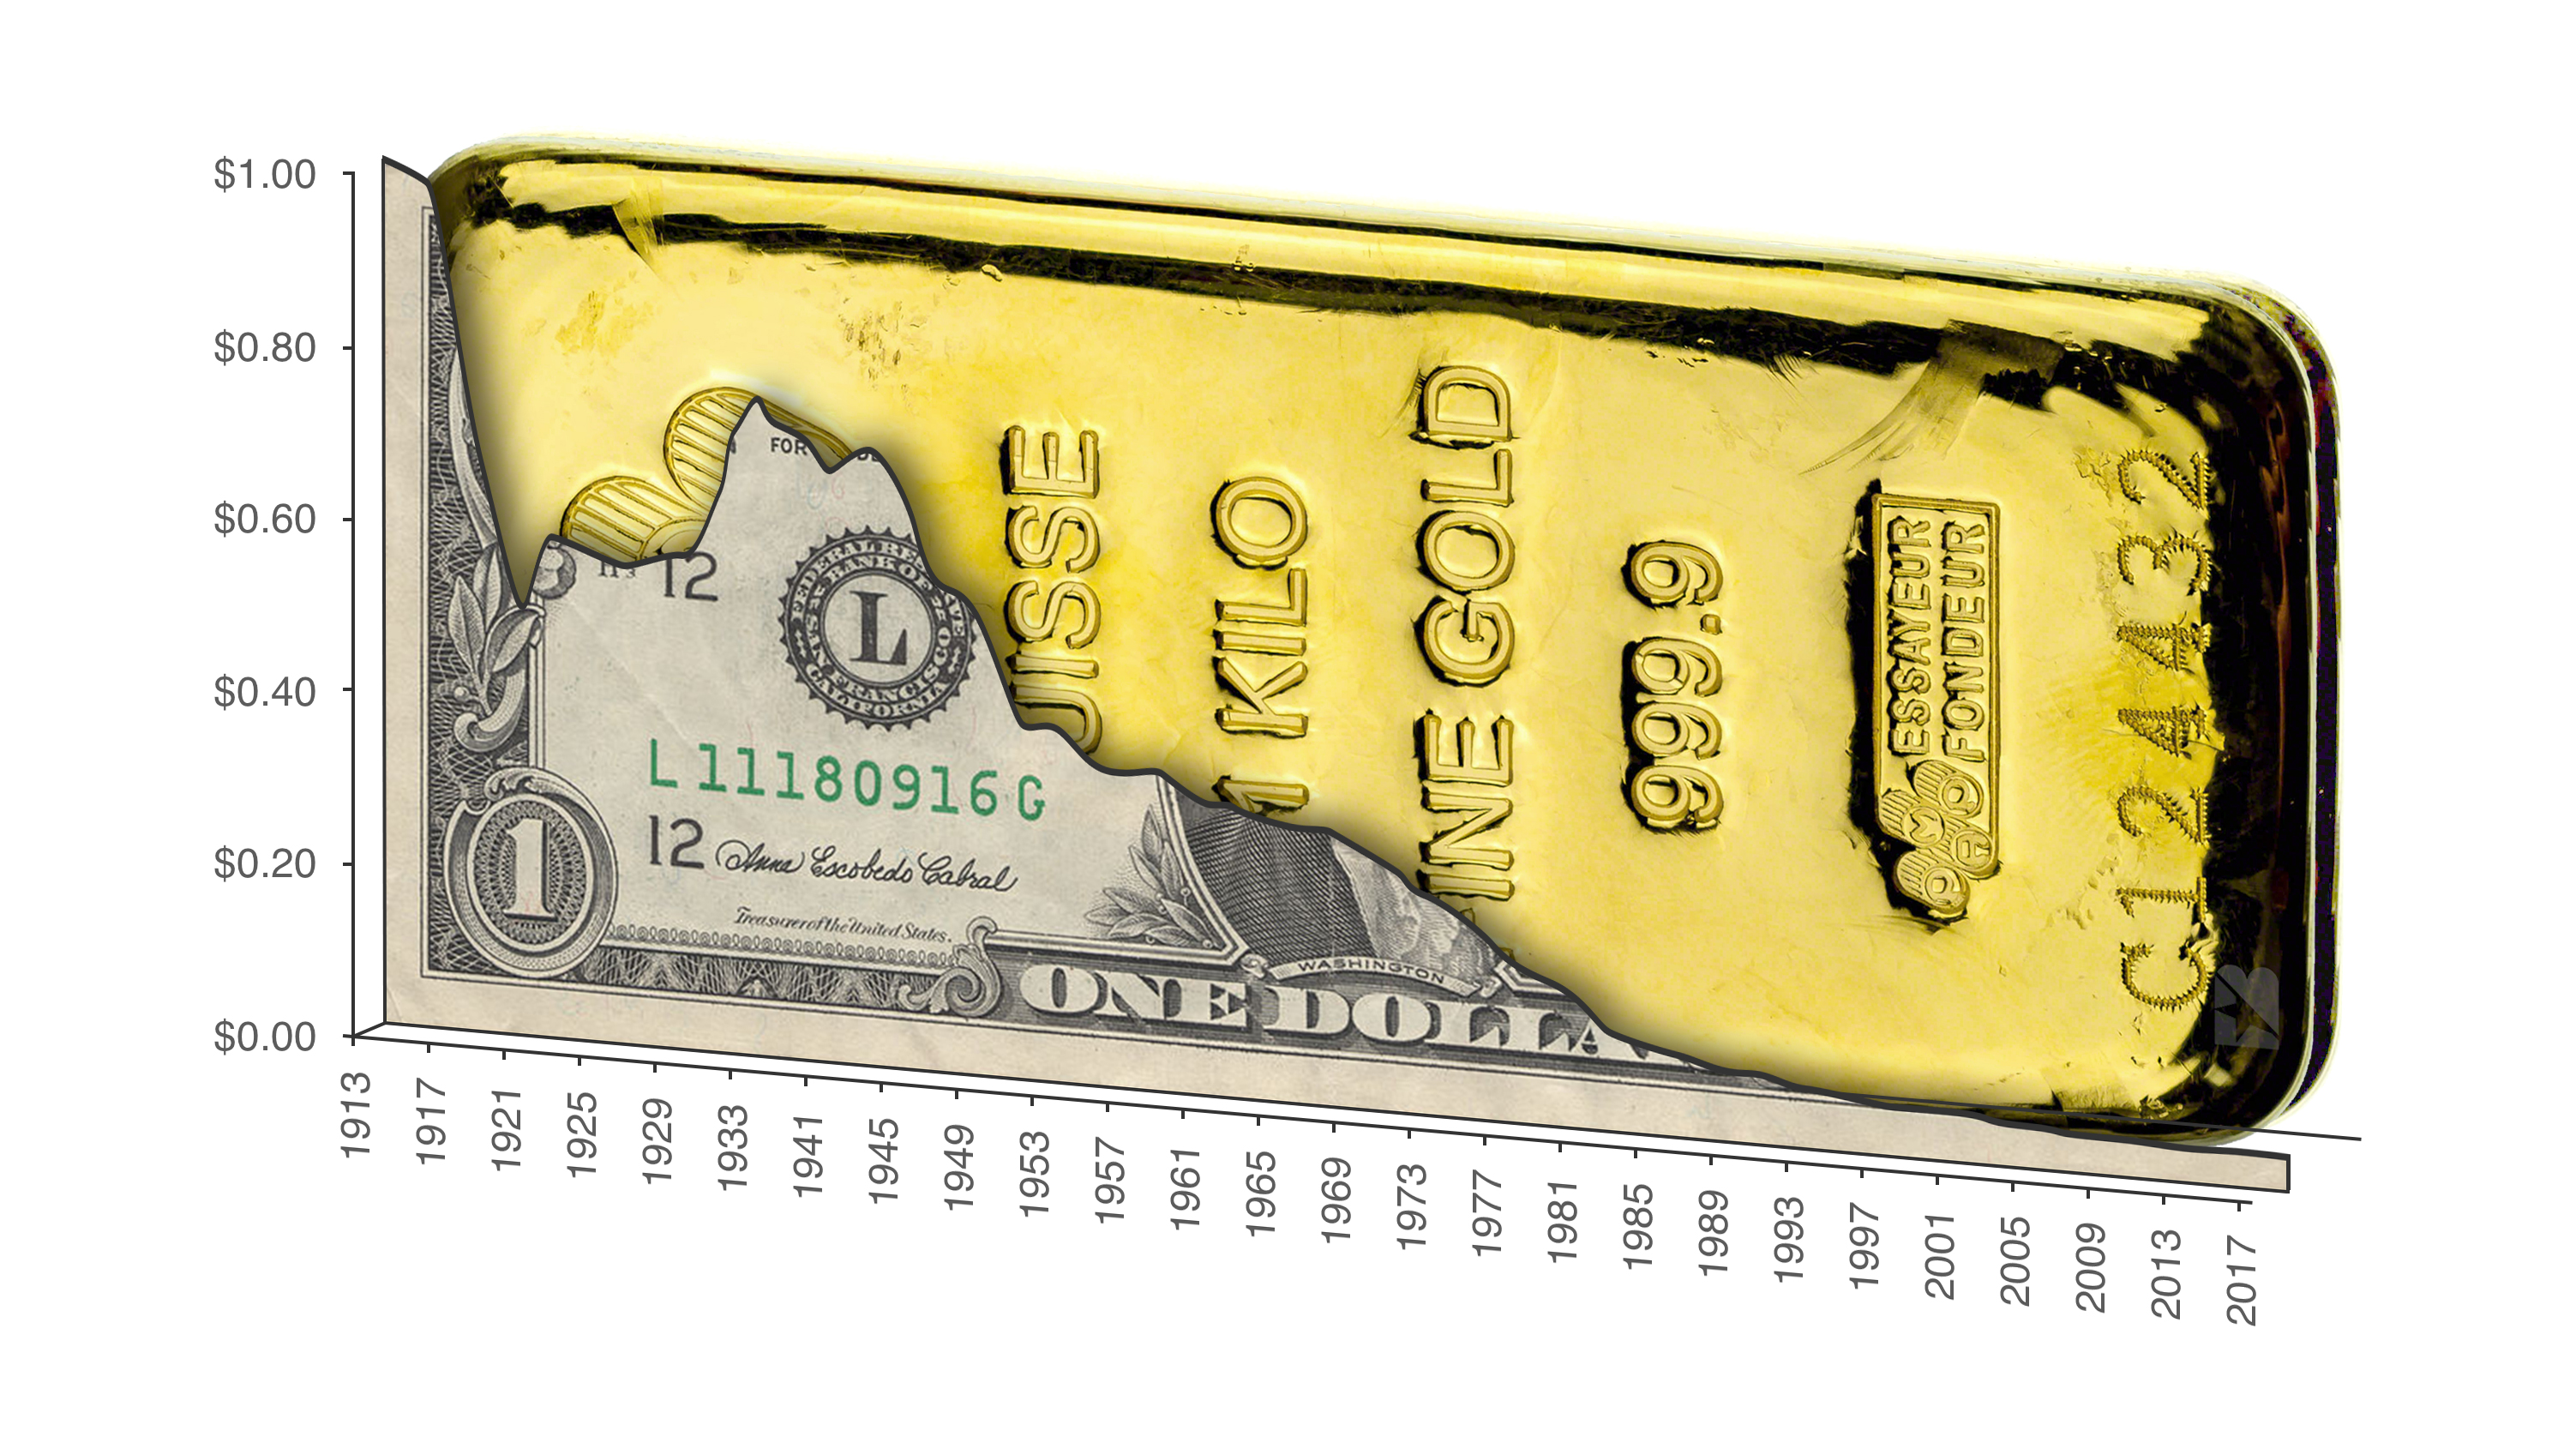 The US Dollar has lost more than 98% of its value since 1913, while gold has retained its value. |

Tags: $CAD,Bitcoin,brl,Canadian Dollar,currencies,Ethereum,Forex,gold bars,gold coins,gold price,newslettersent,SEK,silver,Swedish Krona,Swiss Franc,Uncategorized,US dollar