In this article I point to the pressures on the Fed to moderate monetary policy, but that will only affect the timing of the next cyclical credit crisis. That is going to happen anyway, triggered by the Fed or even a foreign central bank. In the very short term, a tendency to moderate monetary policy might allow the gold price to recover from its recent battering.
 Unlike the last credit crisis when the dollar rose sharply in a general panic for safety, on the next crisis, the dollar is likely to fall substantially. The reason is that foreign ownership of dollar investments (typically in US Treasuries) appears greatly overextended, and an additional $4 trillion of liquidity is in the wrong (non-US) hands. This is likely to be unloaded during a general credit crisis, driving the dollar lower.
Domestically, in the next credit crisis the Fed is certain to support the banks, provide finance for a runaway government deficit and stabilise the private sector by injecting further liquidity into an economy already awash with dollars. Therefore, not only will the dollar fall on the foreign exchanges, but its purchasing power in the hands of American citizens seems certain to fall as well.
And finally, I demonstrate how fluctuations in the quantity of paper gold makes a nonsense of the conventional supply and demand approach to analysing and forecasting gold price trends. Futures and forward markets have deflected demand from physical metal, a situation that depends on confidence in the dollar as a stable currency being maintained. Only a marginal shift away from paper towards physical gold will undermine the whole paper-gold system.
The journey to the next credit crisis
Recently the gold price has depended on the dollar’s cross-border flows. They in turn have been driven by market perceptions of increasing credit risks in emerging market currencies, and the Fed’s policy of normalising interest rates while other major central banks are still applying monetary stimulus. The result has been a stronger dollar on its trade-weighted basis and a weaker gold price.
This is short-term. Long-term, there can be little doubt that the trend of a falling dollar measured in gold will continue, which has seen the dollar lose 97.5% of its purchasing power relative to gold over the last fifty years. We know this because it is official policy to maintain price inflation. While the long-term can take care of itself, we need to assess what is likely to happen in the next few years, particularly in the event of a mooted recession, and also the next credit and systemic crisis, which we know to be a periodic event.
Monetary policy now stands at a crossroads, with America’s economy in the mature phase of the current credit cycle. The Fed plans to continue to reduce its balance sheet and to raise the Fed Funds Rate by at least one half of a per cent by the year end. At the same time there are concerns in some quarters that the economy is already being slowed by monetary tightening. Even President Trump has broken with convention and commented negatively about the Fed’s tightening policy.
There appears to be similarities with the little-known minor recession of 1927, which turned out to not be a recession at all. Since the depression in 1920-21, the US economy had grown rapidly on the back of monetary expansion and technological innovation. By 1926, ordinary Americans were enjoying a standard of living undreamt of in the years following the Great War. There can be little doubt the economy was in its mature phase of the credit cycle and generally booming from 1925 onwards. A mild recession was then detected by the Fed in late 1926, so it made substantial open market purchases and eased the discount rate. The stock market was propelled into its final manic phase. The pause in the economy, for that was all it was, was subsequently attributed to Henry Ford switching production from the Model T to the Model A, necessitating the closure of his factories for several months.
Today’s spanner in the works could turn out to be the disruption to trade from Trump’s policy on trade tariffs. But we shouldn’t take historical comparisons and their outcomes too literally, and there are few signs yet of some sort of economic pause. True, the growth in broad money supply has slowed to 3.8%, and the yield curve is deemed flat by historic standards. The combination of slow growth in money supply and a flat yield curve often presages a recession, but it should be borne in mind the US economy is already awash with deposit money.
It turned out that ninety-one years ago the Fed overreacted. So far today the Fed is sticking to its current monetary policy. But President Trump is kicking back. Undoubtedly, he will be supported by businesses addicted to cheap money and which want to see their profits bolstered by a weak dollar. It could become politically difficult for the Fed to continue on its course of gradual tightening.
If we see signs of the Fed succumbing to pressure to let up on monetary policy, we can expect the dollar to ease. Perhaps that time is approaching. However, the Fed cannot look at monetary policy in isolation, but in the context of a widening budget deficit. The Congressional Budget Office forecasts budget deficits increasing incrementally from $804bn this year to $1,526 in 2028 on current economic and fiscal policies. These deficits represent a significant increase of fiscal stimulus coinciding with a monetary policy that is coming under pressure to be eased.
Worse still, if President Trump follows through with his threats to impose import tariffs, the general price level will rise, which the Fed will find impossible to ignore.
Of course, it is possible that the slowdown in money supply growth and a flattened yield curve as indicators of an approaching recession should be taken more seriously than today’s full employment and above-target inflation figures. Or perhaps a full-blown credit liquidation crisis is already on its way without further monetary tightening, as various doomsters tell us. Therefore, it seems unarguable that whether the Fed loosens now and tightens later, or alternatively continues to gradually tighten, the US economy is heading for a cyclical credit crisis anyway, with only the timing being an issue. I am on record as having pencilled in a credit crisis towards the end of this year, possibly by mid-2019 at the latest, and I see no reason to change that opinion.
Of course, the trigger for the next credit crisis may emanate from the EU, China or Japan. Furthermore, memories of the Asian financial crisis in the late nineties when several currencies collapsed against the dollar still inform scholarly articles. All the signs of overheating economies in South-East Asia have indeed returned. Surely, say the financial experts, experience tells us that just the threat of a credit or systemic crisis will trigger a flight into the dollar, because everyone needs safe-haven dollars.
| The current dollar rally appears to have been driven in part by this thinking. It accords with the dollar being regarded as the riskless standard for portfolios and businesses alike at a time of systemic crisis.
However, with respect to the dollar the situation is totally different from previous credit crises, particularly in the years running up to the last one in 2008-09. This is shown in Table 1, which highlights the cumulative capital flows in the credit cycle before the last credit crisis in 2008, compared with the flows since. In the previous credit cycle (2003-2008) the cumulative trade deficit was broadly matched by net foreign investment and the repatriation of capital by US residents. This is not the case during this cycle, which has seen additional capital inflows of some five trillion dollars. Supplemental to Table 1 is foreign investors’ dollar liquidity, which Exhibit 19T in US Portfolio Holdings of Foreign Securities as of June 2017 is recorded as an additional $4.217 trillion, accounting for the bulk of the remainder of the inward capital flows. These findings are central to how the dollar is likely to behave during the next credit crisis. It is a feature of any credit crisis that foreign currency exposure is liquidated where possible to provide support for domestic obligations. To some extent this is offset by the dollar’s reserve currency status, making dollars the last foreign currency to be liquidated where more than one foreign currency is held by non-US entities. The figures in Table 1 show that the common assumption a future credit crisis will trigger a buying stampede into the dollar is going to be wide of the mark. Foreigners are already up to their eyeballs in dollars, and in a cyclical credit crisis are almost certain to be massive sellers. They have a $4 trillion cash cushion available to unload before they even start on their US Treasuries. |
USD Cumulative capital flows - $billion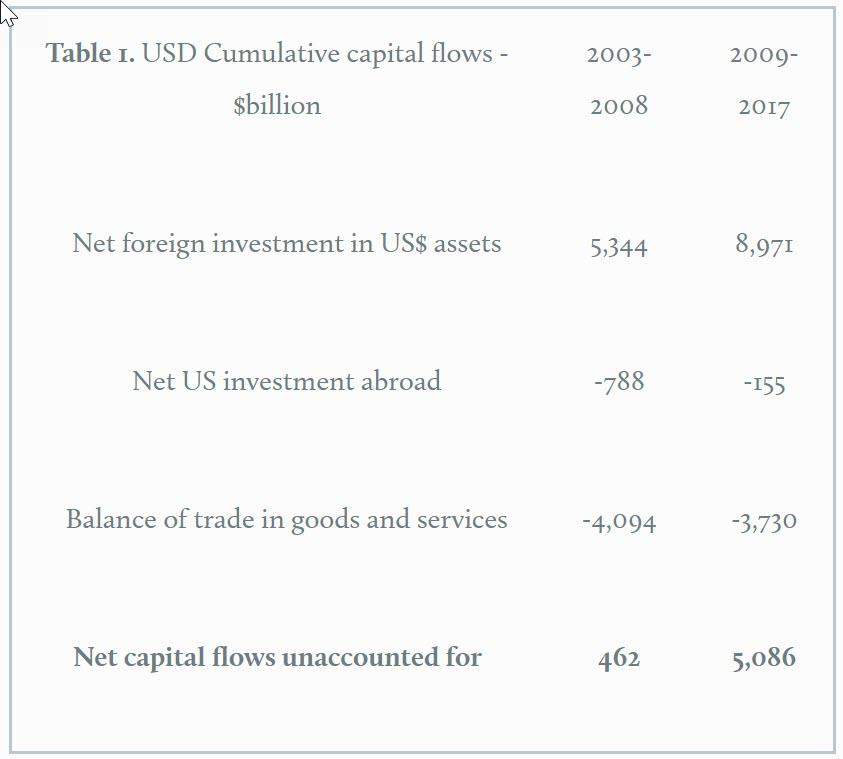 - Click to enlarge |
Domestic impact of the next credit crisis
During a credit crisis we can expect the central banks to intervene both to support their domestic banking system and to coordinate rescue policies with each other. In addition, the Fed is certain to do whatever it takes to prevent widespread commercial bankruptcies and to ensure rapidly escalating fiscal shortfalls are covered. As a priority the rate of price inflation will be a distant second to saving the system. Initial easing of the dollar might be seen by the Fed as beneficial, reflationary at a time of escalating bankruptcies.
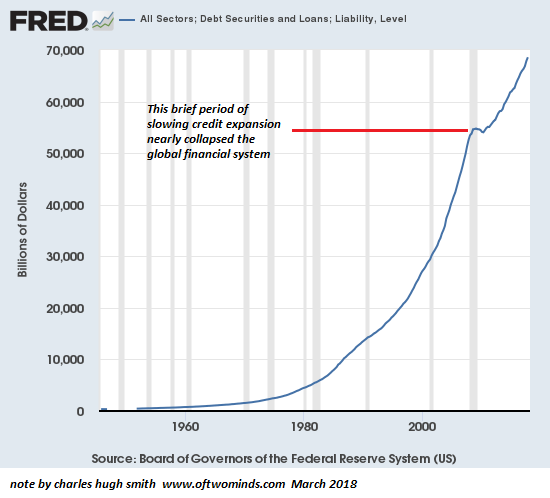
Given the increase of debt in the economy since the Lehman crisis, the amount of rescue support required will almost certainly be far greater than anything seen before. The Lehman crisis involved writing open-ended cheques to a theoretical extent that I estimated at the time totalled some $13 trillion.
The effect on domestic prices is likely to be severely inflationary following the next credit crisis, because the renewed flood of liquidity will be in addition to the increase in bank deposits since the last crisis. At the end of 2017, savings deposits plus checkable deposits plus currency in circulation totalled $12.8 trillion, representing 66% of GDP. At the end of 2007, the last full year before the crisis, they totalled $5.22 trillion, representing only 36% of GDP. If as a base case we assume that in the next credit crisis, monetary expansion to avoid widespread bankruptcies is at least as much again as occurred following Lehman, then we are likely to see cash plus savings deposits plus checkable deposits increase to a figure greater than GDP.
It is hard to see any policy alternative, other than just letting the whole system crash. Therefore, we can expect quantitative easing to return with a vengeance, not only to recapitalise the banks, but to cover escalating government deficits. As can be inferred from the money flows in Table 1 above, US national finances have been made perilous by relying on foreigners to finance budget deficits. They are less likely to buy Treasuries in a global credit crisis, because they already have too many and will want to sell their surplus dollars rather than invest them. The gold price will likely adjust to discount a veritable tsunami of dollars emanating from the Fed and from foreign holders at the same time.
The indications are that the history of our times will identify the next credit crisis as pay-back time for America’s continual deficits and the illusion that foreigners will always finance them. While the Fed has no practical alternative to ensuring that dollar debt doesn’t liquidate, the consequence can only be to collapse the dollar.
The last time a comparable dollar crisis occurred it led to the abandonment of the Bretton Woods system by President Nixon, when previously exported dollars were in such excess that their return caused the post-war monetary system to collapse. That led to the gold price rising from $35 to a high of over $800 in January 1980, an increase if replicated this time would take gold to over $25,000.
The outlook for the gold price and why supply and demand statistics are useless
The few specialists analysing monetary gold recognise that the only form of gold worth owning in the event of a systemic collapse of the fiat currency system is physical gold, or at the least, gold that is safely vaulted beyond the reach of the banking system. While this is unarguably true, so long as the current financial system of fiat currencies persists, the supply of non-physical forms of gold is bound to dominate the price.
Traditionally, analysts of consumed commodities such as base metals talk about supply and demand in terms of mine output and user demand. However, nearly all the gold ever mined still exists. Some is monetary metal in the broadest sense, and probably more than as much again is classified as jewellery. Even here, the lines are blurred, because Asian buyers of jewellery see it as having a dual purpose, both as adornment and monetary savings.
| Updating Goldmoney’s 2012 estimate of above ground stocks gives us a figure of 172,975 tonnes as of 2017. Annual mine output currently amounts to approximately 3,000 tonnes per annum, and recycled scrap, counted as additional supply to the market, is perhaps a further 750 tonnes. These figures are dwarfed by the supply of paper gold. Chart 1 shows how the sum of mine output, scrap recycling, Comex futures and over-the-counter derivatives have varied from year to year.
Total changes in annual supply are substantial, hitting a peak in 2007 of 5,800 tonnes, falling to 1,445 tonnes in 2008, following a contraction in OTC derivatives and outstanding Comex contracts in the wake of Lehman’s collapse that September. The expansion of supply last year was recorded at 4,168 tonnes. |
Total identified annual gold supply, 1999-2017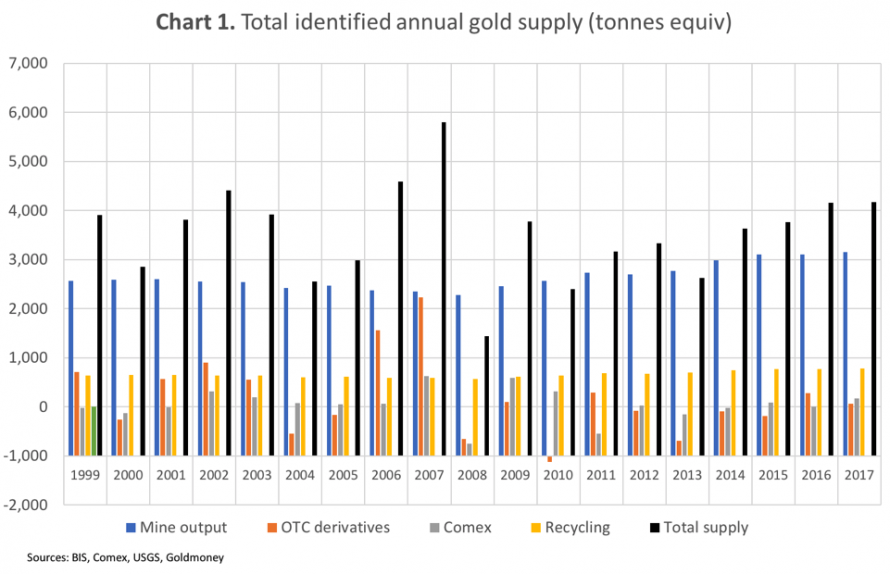 - Click to enlarge |
| Even these figures fail to capture the full picture on two counts. The four categories of supply in Chart 1 aren’t the only ones, and more importantly, they are only year-end snapshots. Supply is a continual process, with every transaction a record of both supply and demand. One should add up all the daily turnover volumes on futures exchanges for a start. The London Bullion Market provides this information on a daily settlement basis for the forward market, which forms the bulk of OTC derivatives in the Bank for International Settlements statistics. This is shown in Chart 2.
Compared with changes in supply on a year-end basis, the totals dwarf mine supply, and they do not even include intra-day buying and selling. It shows how misleading statistics based on mine output and recycled scrap alone are for discussing gold prices. |
Gold tonnes cleared annually on LBMA, 1999-2017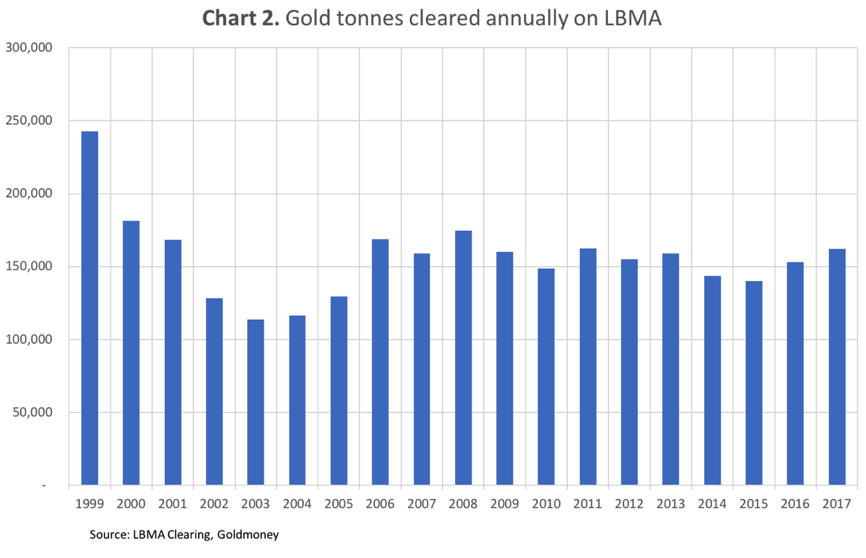 - Click to enlarge |
We cannot know how the ever-elastic paper supply to satisfy demand without moving the gold price might expand or contract in future. We can only be certain that it will disappear entirely if paper currencies become worthless and so we can presume a falling dollar will gradually undermine the whole paper pyramid. Until that time, it is only clear why the Svengalis operating in the paper gold markets have been able to supress demand for physical gold by inflating paper supply to many multiples of the physical.
It also explains why the combined demand for physical gold from Asian markets can consistently exceed mine supply without the price being unduly affected. It is, however, a situation that cannot continue indefinitely. Paper markets for gold only work so long as participants do not demand delivery of physical bullion. The bullion banks strongly resist this, not only in the paper markets but also, reportedly, some German and Swiss banks are today refusing to return physical gold held by their clients in supposedly allocated accounts.
Investors simply hoping for a profitable trade on the price of gold do not appear to understand that gold is money, not a speculative investment. They are likely to find that as the purchasing power of the dollar declines with increasing rapidity it is never worth selling gold, or any other asset including cryptocurrency for that matter, to book profits in a declining fiat currency.
Gold is and always has been the non-speculative hold-it-until-you-are-ready-to-spend-it money, whose purchasing power gently increases over time. It is monetary calm while everything else is in flux and deserves a premium value for that quality alone.
Conclusion
We cannot be sure what form the next credit crisis will take, but we can be certain it will happen, because it is a cyclical event created by central bank monetary policy. Once that fundamental point is grasped, it follows that the severity of the crisis is proportional to the monetary distortions that precede it. The next credit crisis will almost certainly dwarf anything seen so far in the fiat currency era.
Following the next credit crisis, the suppression of the gold price by expanding the quantity of paper derivatives will become less effective at controlling the price when the purchasing power of the dollar deteriorates under the sheer weight of its increased quantity.
The price of gold can be expected to rise significantly higher when measured against fiat currencies. How much depends on the degree and the rate at which fiat currencies lose purchasing power. To understand this properly it helps to reapply the pricing relationship between gold and fiat currencies when fiat currencies were defined by their weight in gold. That is to say, gold is the objective money and fiat currency bears the subjective price. This turns $1230 per ounce into 25 milligrams of gold per dollar. We may have to get used to it and be ready to price the dollar in micrograms as well.
Full story here Are you the author?Tags: newslettersent