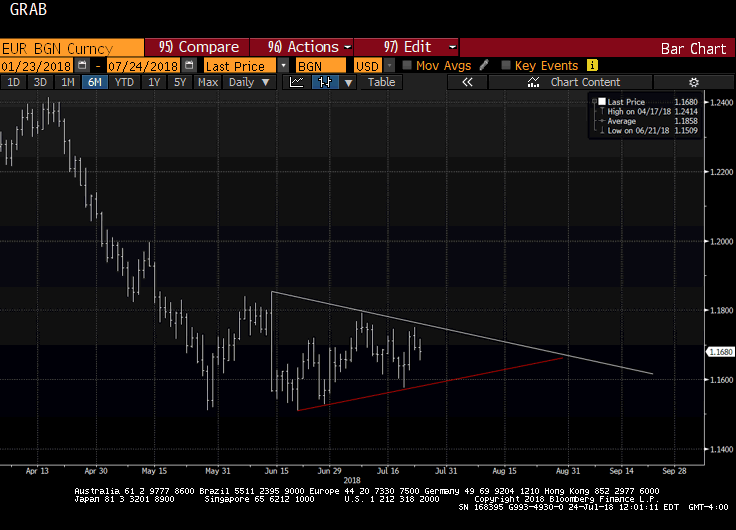
| Speculators in the futures market are still net long the euro. They have not been net short since May 2017. In the spot market, the euro approached $1.15 in late-May and again in mid-June. Last week’s it dipped below $1.16 for the first time in July and Trump’s criticism of Fed policy saw it recover. Yesterday it reached $1.1750 before retreating. On the pullback, it held the 61.8% retracement of the recovery (~$1.1640).
Many frustrated dollar bears think the euro is basing and anticipate a breakout to the upside, spurring a recovery that leads to $1.20 by year-end. The technical case is clear. At $1.1850, seen in mid-June, the euro already retraced 38.2% of the decline that began in mid-April near $1.2415. The 50% retracement is near $1.1960, and the 61.8% retracement is by $1.2070. The technical indicators, such as the Slow Stochastics and MACDs on the weekly charts are supportive. While this is possible, we see the technical position a bit differently. The Great Graphic shows how the euro has been tracing a triangle or wedge pattern after the April-May leg down. It is most often a continuation pattern. A break to the downside would give measuring objective near $1.12. However, it remains a few weeks from the apex, and this is consistent with continued range-bound activity. Regardless of one’s views, a break from the triangle pattern will likely be among the first indications of a new trend. Tomorrow, the top of the pattern is near $1.1750, and the bottom is found around $1.1580. At the end of the month, in one week’s time, the boundaries are $1.1600 and $1.1735. |
EUR/BGN, daily |
Full story here Are you the author? Previous post See more for Next post
Tags: $EUR,Great Graphic,newslettersent


