Manipulation of Gold and Silver by Bullion Banks Is “Undeniable”
by David Brady via ZeroHedge
|
Silver Change |
As a former spot currency trader for a major international bank, I have had first-hand experience of central banks directly intervening in currency markets in massive size, repeatedly.
You’ll hear a lot of people say market manipulation is a conspiracy theory, despite the fact that it has been proven in court several times in various assets classes and especially in precious metals.
Books have been written about gold and silver manipulation for decades. Central bankers have admitted it publicly. Now it has become so obvious that it’s predictable.
I know because I made 500% in less than 24 hours on Friday last on a 1-week SLV 15.50 strike put option I bought on Thursday at 2 pm. I bought that put expecting the Bullion banks to come in and hammer the metals, given the typical signals I was seeing ahead of each time they slam Gold and/or Silver lower. Moreover, I began warning people on Twitter a week ahead of time that this could happen (note the dates posted):
I’ll provide those typical signals later, but let’s take a look at what happened to Gold…
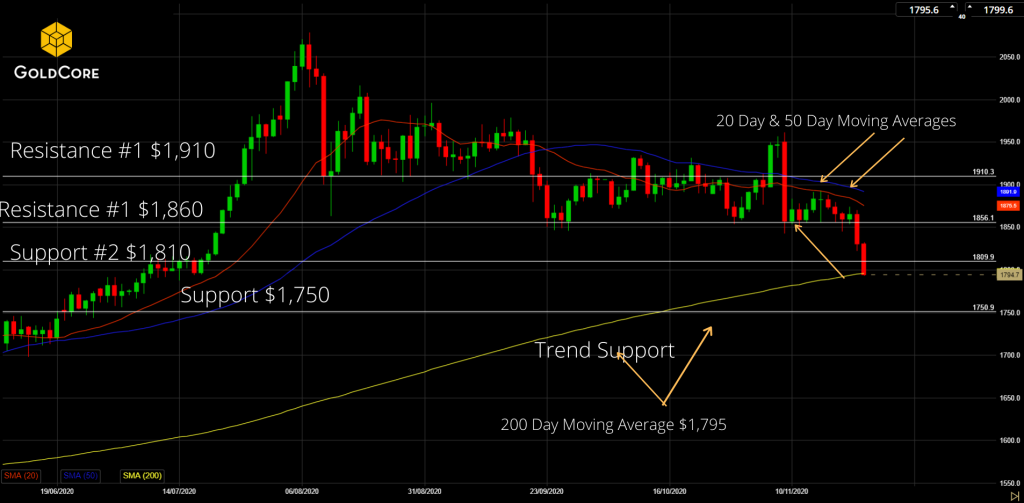
Since May 24th, Gold has been capped at its 200 day moving average despite being oversold, extreme overbearish per the DSI and Funds positioning being at levels that has consistently led to strong rallies over the past 3 years. Yet, on this occasion the price went down?
So why did the price go down? Below is the daily changes in Gold open interest (“OI”) on the COMEX up to and including Friday last.
Notice how OI rose significantly around May 10, and the price of Gold fell hard. Then OI fell consistently but the price did not rise, instead it remained capped under its 200-day MA. Then, beginning Tuesday, June 12 and for the next two days, open interest rose a total of 18k contracts. Given that the price only appears to go down when open interest rises and sideways when it falls, it seemed safe to assume that the price would fall on Friday as it did around May 10, and that is exactly what happened. In fact, open interest rose again on Friday for a cumulative 26k contracts in just four days.
Looking at a cumulative chart, you can see how open interest fell steadily since mid-May. This is normally bullish. In fact, open interest fell below 450k which, as the chart below shows, is very bullish for Gold. Yet Gold didn’t rise. Then note how cumulative open interest suddenly rose in the days up to and including Friday. Something was brewing. And based on multiple similar experiences in the past, I expected the worst, and we got it Friday.
But we didn’t have to rely on open interest alone to figure out what was happening. The COT data for June 5 already told us in advance. The Banks had previously been extremely long, which is rare for them and almost always leads to higher Gold (and Silver) prices—they are the so-called “smart money” after all—but it did not in this case. Gold remained below its 200-day moving average. On June 5, the COT report showed that the Banks had raced to get short in just one week, so fast that it was at a record pace. Now why would Banks be racing to get short unless they believed or knew that the price was going down? And down it went, on schedule, the following week.
| The chart below shows the one week change in Banks (“Swaps”) positioning on June 5:
The chart below shows the change in the Banks’ absolute position from net long to net short on June 5 and increased further on Friday, June 12, just as open interest rose. Note how the price did not rise when they were long, and yet it did in every other instance. Instead, it fell this time around. This was even clearer in Silver. When the Banks significantly cut their short position or go long, the price of Silver rises. Yet the price did not rise when they were extreme long recently, whereas it did every time they were less long in the past. Yet, it fell the moment they went short! This is just a sample of the Bullion Banks’ ability to manipulate Gold (and Silver) prices by capping them and forcing them lower. Why? To make a profit. Then why don’t they buy it and make a profit on the upside? Because as several central bankers have admitted, a rising Gold price reflects an increasing lack of confidence in the system and specifically in the dollar. The Big Banks own and work with the Federal Reserve in maintaining confidence in the dollar and the system at large by suppressing the price of Gold. Manipulation is always to the downside for this reason. Easy money for the banks, which can create and sell naked futures contracts at will, but it comes at the expense of everyone else. Markets are a zero-sum game, and the banks don’t lose money in Gold and Silver. At least, JP Morgan does not, ever. |
Silver Large Trader Position |
| Central banks around the world are also repatriating their Gold from the U.S. in preparation for some major event to come. I want to be long, too, when that event occurs.
In summary, manipulation in metals is undeniable. It has become so chronic that it is now obvious and therefore predictable. Unfortunately, it can temporarily undermine or render traditional analytical tools as useless. You need to be aware of this to protect yourself when it is about to happen again, because it will. |

Never miss an episode of The Goldnomics Podcast – Listen and subscribe on YouTube, ITunes, Soundcloud or Blubrry |
The signals of pending manipulation in Silver are similar to those in Gold . While Platinum tends to follow its two bigger siblings. I saw several of these signals in Silver last week, telling me that it was about to dump on Friday and based on multiple similar situations, I have come up with the following list which I use to predict when the Banks are about to slam Silver. Not all of these factors are required, but usually it’s a combination of several when manipulation occurs:
- Following a Large Rally (almost always the case)
- Silver price > 200D MA – push price below the 200D MA to trigger “algo” selling for maximum effect
- Overbought: RSI >65 and sometimes negatively divergent
- Sentiment is extremely bullish (DSI)
- MACD Histogram (and sometimes with MACD Line) is overextended to the upside or negatively divergent or both – yes, banks watch charts too.
- At key resistance (trendline resistance, prior high, or key Fibonacci resistance)
- Large increase in open interest ahead of time
- Funds load up long – either (1) Massive or record net long position or (2) huge increase in longs over two or more previous weeks
- Time it on or shortly after a special event: Fed rate hike, Presidential election, Non-Farm Payrolls, announcement of QT
- Time it during illiquid periods for maximum effect: holidays (e.g. Chinese week-long holiday, “Golden Week”—note the irony—Chinese New Year, July 3rd or 5th, Thanksgiving week, Christmas holidays), Fridays or Mondays.
- Time it post Futures / Options expirations also – e.g. triple /quad witching
Watch for these factors to expect the risk of another sell-off, triggered by short-selling on the part of the Bullion Banks using naked futures.
Why is this important? Because despite what everyone tells you to the contrary, markets are controlled, and Gold and Silver in particular. Technicals, sentiment, and positioning are important tools, but you need to be aware of the risk of manipulation undermining the message these tools are telling you.
So why bother with such tools at all? Why buy Gold or Silver? The banks use the same tools we do to determine when to force prices lower, which is why their behavior is predictable. Second, manipulation has an expiration date, as demonstrated in the 2000s and 1970s in particular. They cannot stop metal prices going up forever, and you want to be around for when Gold and Silver soar next. They are the most undervalued assets out there today. Plus, I follow the smart money. And China, Russia, and JP Morgan have been loading up on physical metals for years now.
Full story here Are you the author? Previous post See more for Next postTags: Daily Market Update,newslettersent


