- U.S. withdraws from Iran nuclear deal
- Oil jumps past $70
- Argentina hikes interest rates to 40%
- S. 10 year disparity
- Western buying returns to gold
| Gold and silver both ended slightly up in a week dominated by heightening geopolitical news, weakening inflation data, and emerging market concerns.With gold closing the week at $1,318 (up 0.28%), €1,104 (0.37%), and £973 (0.2%).
In sterling, gold was up strongly on Thursday following the BOE’s decision not to raise rates, and from the weaker than expected industrial production data. |
Gold Price in GBP, May 2018(see more posts on Gold prices, ) |
| Listen on SoundCloud , Blubrry & iTunes. Watch on YouTube below | |
| On Tuesday the U.S. pulled out a nuclear deal with Iran with oil jumping on the news, pushing past $70 for the first time since November 2014. In other markets, the move was less pronounced, prompting suggestions the move in oil was more over concerns of losing production (at a time of already falling crude inventory), rather than from the geopolitical event itself.
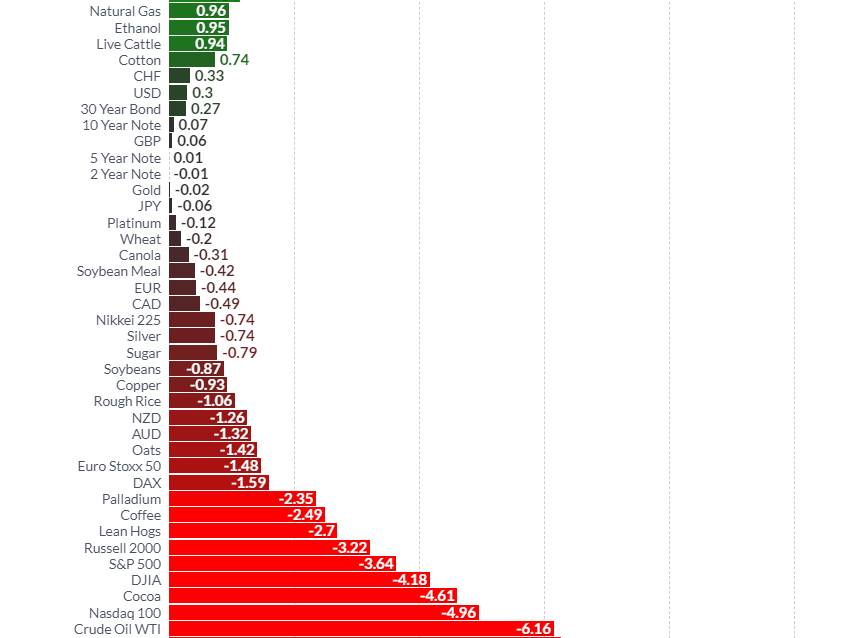
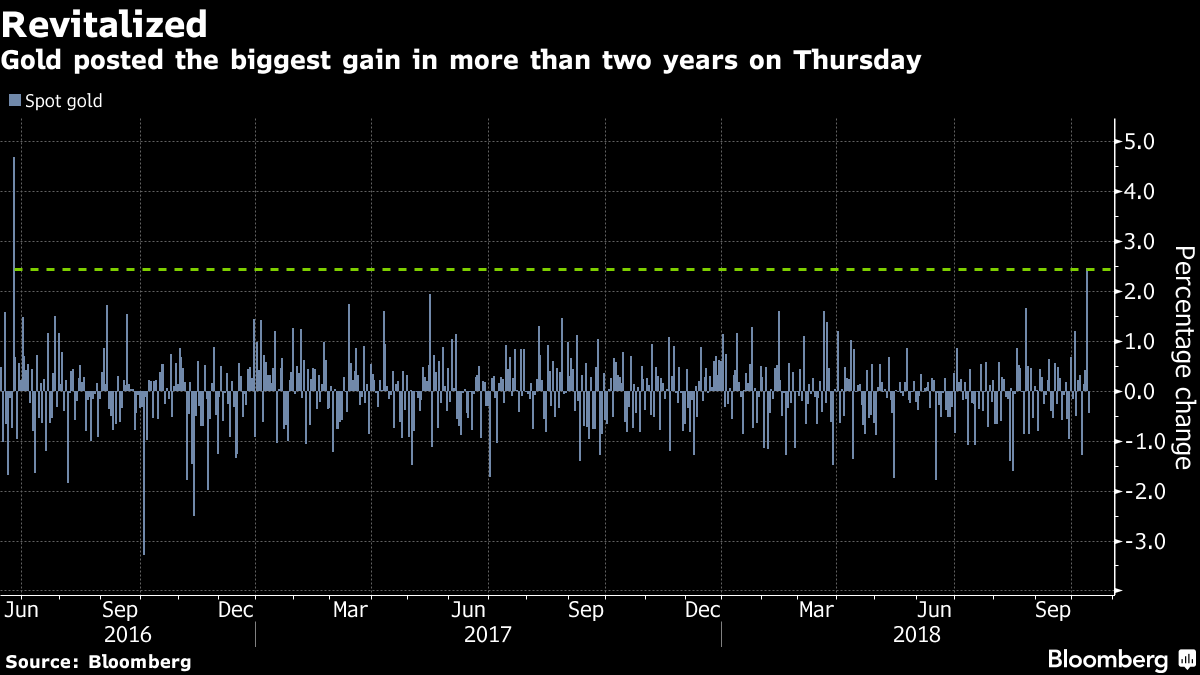
However, with middle east tensions rising by the day, the geopolitical risk remains extremely high. With the main question remaining, will gold soon follow oil’s move higher as investors seek protection in the world’s premium safe haven asset? Economic data this week came in worse than expected, with inflation readings of 0.1% vs consensus of 0.2%. The market was initially unmoved following the PPI release on Tuesday, but once CPI confirmed the prospect of weakening inflationary pressures on Thursday, both gold and silver reacted along with the rest of the commodities sector, including platinum, palladium and copper, all ending the day notably higher. Stocks were one of the best performing assets this week, with U.S. indices up between 2-3%, with investors in the short-term moving back into risk assets. The U.S. dollar ended the week flat (up 0.02%), giving back early weak gains from the miss in inflation, and talk of ‘profit taking’. Yields, like the dollar, started the week strong but ended the week down 0.27%. Full weekly performance, courtesy of Finviz.com. (https://finviz.com/futures_performance.ashx?v=12) |
|
| Emerging markets continued to deteriorate this week, with Argentina and Turkey notably effected. Argentina has recently hiked interest rates to 40% in an attempt to stabilise a free falling peso,and is currently seeking assistance from the IMF to avoid outright default.Turkey are taking similar measures, albeit not so aggressive, but still in attempt to fight soaring inflation at 11%
A strong U.S. dollar, and bond yield (when compared to global peers), is the main catalyst behind the deteriorating situation. During the expansionary period, following the 2008 financial crisis, low interest rates and an abundant supply of fresh Central Bank liquidity allowed easy money to flow into the emerging markets.But as U.S. yields went up, so too did the funding costs, making emerging market investments a less attractive prospect, causing capital to flow out of these markets and back into the ‘perceived’ safety of a 3% return in the U.S. Highlighting the disparity in global yields,only Greece, Mexico, India and Brazil currently pay more than the U.S. to service their 10 year debt – quite a startling statistic for the world’s reserve currency. |
|
| While Fed members have indicated they are staying put on their current ‘dot plot’ rate hike trajectory, at some point they will need to take note of the growing yield disparity.It’s this writer’s view that if the spread continues to widen, and the effects start to begin to spill over into the wider economy, the Fed will be forced to take action and realign to a more accomodative global policy – all of which is a bullish prospect for the precious metals complex.
Taking a look at the latest fundamental developments, the WGC have released their ETF inflow/outflow data this week, with the report showing strong growth in April. “Global gold-backed ETFs holdings added 72.2 tonnes (t) to 2,481t in April. This is the strongest month of net inflows in more than a year. Growth in global holdings was les by significant North American and European inflows and supported by a small increase in Asia” (https://www.gold.org/data/gold-etf-holdings) |
Monthly Flows, Feb 2017 - Apr 2018 |
| While the latest data represents the largest monthly inflow since February 2017, more importantly it shows North American and European buyers coming back into the market. Western demand has long been regarded as the key to higher gold pricing, and while this is first significant inflow from the west this year, should this trend continue it has bullish implications moving forward.
From a technical perspective, we can see gold has found significant support at 200 day moving average ($1307), while building positive momentum that looks poised to breakout to the upside. Should gold push higher from here, key resistance will be at the $1360/$1370 level, an area gold continues to test. (Charts courtesy of Stockchart.com) |
Gold Daily, Dec 2017 - May 2018 |
| In silver we can see the 200 day moving average ($16.81)acting as resistance. However, just like gold, positive momentum is building.
Key resistance for silver will be at $17.30, and then $17.70, with further resistance at the psychological $18 level. Given the bullish technical picture in both gold and silver, and improving COT positioning, means we a likely building a base here, for a more substantial move higher. |
Silver Daily, Dec 2017 - May 2018 |
| The U.S. is meeting with North Korea this weekend, in an attempt to forge a long standing agreement. With the U.S. withdrawing from the Iran nuclear deal this week, it will interesting to see if this impacts the North Korean’s willingness to enter into such a deal. As always the key will be in the detail
In Europe, Italian bond yields continue to climb on the prospect of an anti-establishment coalition coming to power, with the League and 5-star movement party making significant steps towards forming government. Their final policies are an unknown factor for the markets, but with Italy the 3rd largest economy in Eurozone, investors should take note of the Italian yield, and more importantly yields in the rest of the Eurozone, for signs on how the situation is developing. On economic data next week, investors should pay close attention to ‘Retail Sales’and the ‘Philadelphia Fed Manufacturing Index’ for further signs of weakness, April ‘CPI’ from Europe for the latest on inflationary pressures, and April ‘Industrial Production’ from China for an update on global growth. These events, plus developments in the middle east, will help shape the near term direction in the dollar, bonds, stocks, and more importantly the next direction for gold and silver. And finally, a quick look to the key FOMC meeting next month, and the latest Fed Futures pricing (a tool from the CME to indicates future rate hike probabilities). Where, as of the 12th May, the market is pricing a 100% chance of a rate hike June (http://www.cmegroup.com/trading/interest-rates/countdown-to-fomc.html) |
Target Rate Probabilities, Jun 2018 |
Given the market is pricing the event as a certainty means there’s a good chance we could be setting up for disappointment,where gold sells off in the run up the meeting only to rally on the news. A play gold has followed many times on recent rate hike announcements.
All of which means the prospect for the seasonal ‘summer doldrums’ (a seasonal phenomenon discussed last week 5th May) may be short lived, and the buying opportunity in gold may come a lot sooner than many people expect.
Full story here Are you the author? Previous post See more for Next post
Tags: Gold prices,newslettersent,Weekly Market Update


