FOMC Strategy RevisitedAs readers know, investment and trading decisions can be optimized with the help of statistics. One way of doing so is offered by the FOMC meeting strategy. |
|
| A study published by the Federal Reserve Bank of New York in 2011 examined the effect of FOMC meetings on stock prices. The study concluded that these meetings have a substantial impact on stock prices – and contrary to what most investors would probably tend to expect, before rather than after the committee announces its monetary policy decision. |
S&P 500 Index, Jan 1988 - 2018(see more posts on S&P 500 Index, )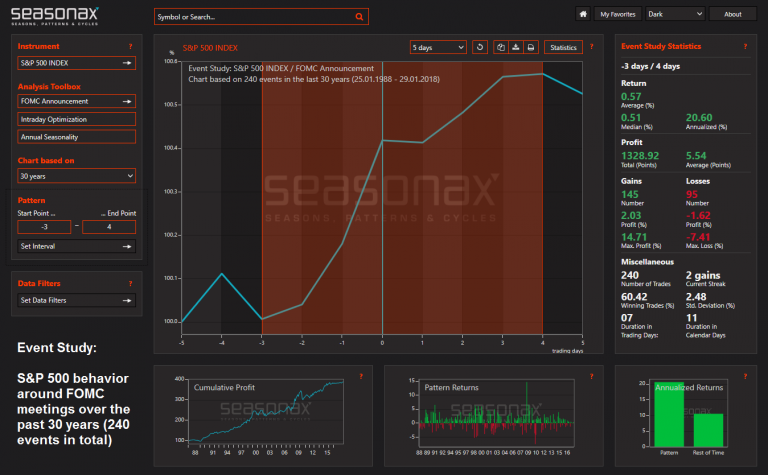 S&P 500, average behavior around the FOMC announcements over the past 30 years (240 events) – the statistics in this chart refer to a one-week holding period (buy 3 days before, sell 4 days after announcement) in line with the maximum average gain (145 gains vs. 95 losses). - Click to enlarge However, the bulk of the gains are achieved in the days before the announcement – the annualized risk-adjusted gain can actually be boosted considerably by confining oneself to this three-day holding period (statistics shown further below). |
Study Shows: Time Period Shortly Before the FOMC Announcement Most Important for Stock PricesThe impact is so strong, that it would have been possible to achieve almost the entire cumulative return of the S&P 500 Index since 1998 if one had invested exclusively during the days when FOMC meetings were held. The next chart illustrates the situation. The blue line shows the trend in the S&P 500 Index since 1998, indexed to 100. The green line depicts the cumulative return of investing exclusively on FOMC meeting days, the red line shows the cumulative return achieved by investing exclusively on all remaining trading days. As can be seen, one could have made a profit almost equal to a “buy & hold” return, while taking substantially less risk by investing exclusively during FOMC meetings – which take up a mere 16 trading days per year. By contrast, the red line is lagging behind by a wide margin. In short, just 6.3 percent of all trading days generated considerably larger returns than all 93.7 percent of the remaining trading days combined! It definitely made a lot more sense to buy stocks in the days leading up to FOMC meetings than buying them thereafter. It was also possible to optimize the timing of sales after the release of policy statements. As these data illustrate, the information provided by event studies is useful for conservative investors as well – it is not only of interest to short term traders. |
S&P 500 Index, 1998 - 2018(see more posts on S&P 500 Index, )A mere 16 trading days per year generated almost the entire return of the index! [Note the action on FOMC days in 2008 – 2009, when the market’s hopes became pinned to the beginning money printing orgy |
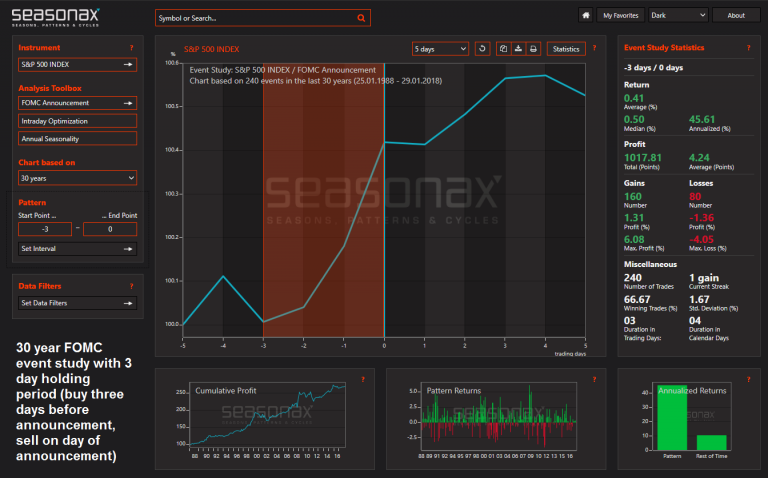
Taking Advantage of the FOMC Meeting Strategy May Be Particularly Promising at the Current JunctureThe FOMC meeting strategy could actually be particularly interesting at this time. Here is why: Stock markets have been in unbroken uptrend for the past nine years. It seems doubtful that they will continue to rally without problems for another nine years; it seems rather more likely that a price decline – possibly a large decline – will eventually take hold. The FOMC meeting strategy tends to generate especially strong outperformance bear market environments. And perhaps a time when the market will weaken is indeed what lies ahead. Under such circumstances, applying the FOMC meeting strategy (and other event strategies suggested by the Seasonax app) will definitely improve returns. The approach is certainly a viable alternative to simply selling one’s entire equity portfolio. Take advantage of FOMC meeting days! Addendum by PT: 3-day Holding PeriodAs noted above, the annualized risk-adjusted return is actually boosted considerably by shortening the holding period from one week to three days. While the average gain is only 41 basis points vs. 57 basis points, the annualized return is ~45% vs. ~20% due to the shorter holding period; obviously, cutting down on the time during which one is exposed also means that one incurs less risk. Moreover, in the past 30 years the ratio of profitable vs. losing trades improves to 160 vs. 80 compared to 145 vs. 95 when using the one week holding period – however, the gap between maximum gains and maximum losses narrows noticeably as well and the cumulative gross profit declines commensurately. |
S&P 500 Index, Jan 1988 - 2018(see more posts on S&P 500 Index, ) |
Full story here Are you the author? Previous post See more for Next post
Tags: central-banks,newslettersent,On Economy,S&P 500 Index,The Stock Market


