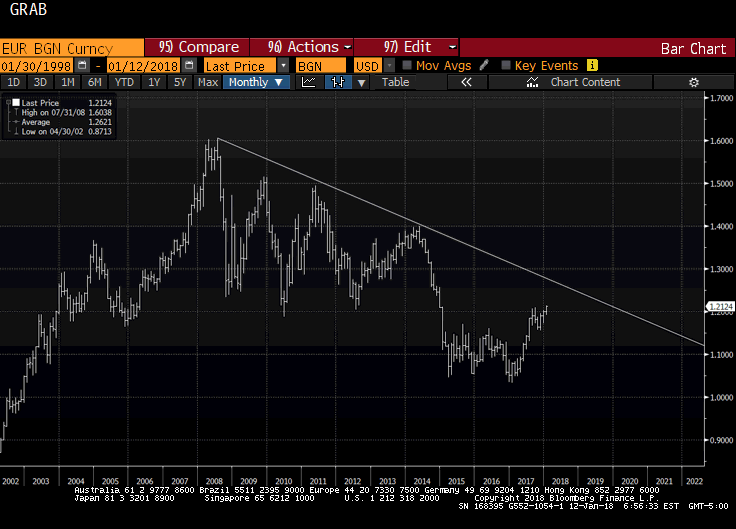
| The euro peaked in July 2008 near $1.6040. It was a record. The euro has trended choppily lower through the end of 2016 as this Great Graphic, created on Bloomberg, illustrates. We drew in the downtrend line on the month bar chart.
The trend line comes in a little below $1.27 now and is falling at about a quarter cent a week, and comes in near $1.26 at the end of February. The $1.26 area also corresponds to a 61.8% retracement of the euro’s last leg down that began in mid-2014. The $1.2520 area represents a 38.2% retracement of the decline since the 2008 record. The correct/consolidation phase we anticipated at the end of last week was hardly a two-day move. The euro is again flirting with its upper Bollinger Band (~$1.2130). The Slow Stochastics have turned down, but the RSI and MACDs have turned up. The market is putting the finishing touches on the what is the fourth weekly advance for the euro, the longest streak since August. |
EUR/BGN Currency, 2002 - 2018 |
Tags: #USD,$EUR,Great Graphic,newslettersent


