| We’ve had a pretty good run of data recently and with the tax bill passing the Senate one would expect to see markets react positively, to reflect renewed optimism about economic growth. We have improving economic data on pretty much a global basis. It isn’t a boom by any stretch of the imagination but there is no doubt that the rate of change has recently been more positive. We also have a change in tax policy that should, if one believes the economists and politicians on the starboard side of the political divide, be positive for future growth. And stock punters certainly seem to believe both, that the incoming data is the beginning of a trend and that the tax bill is a big positive for growth – or at least corporate profits.
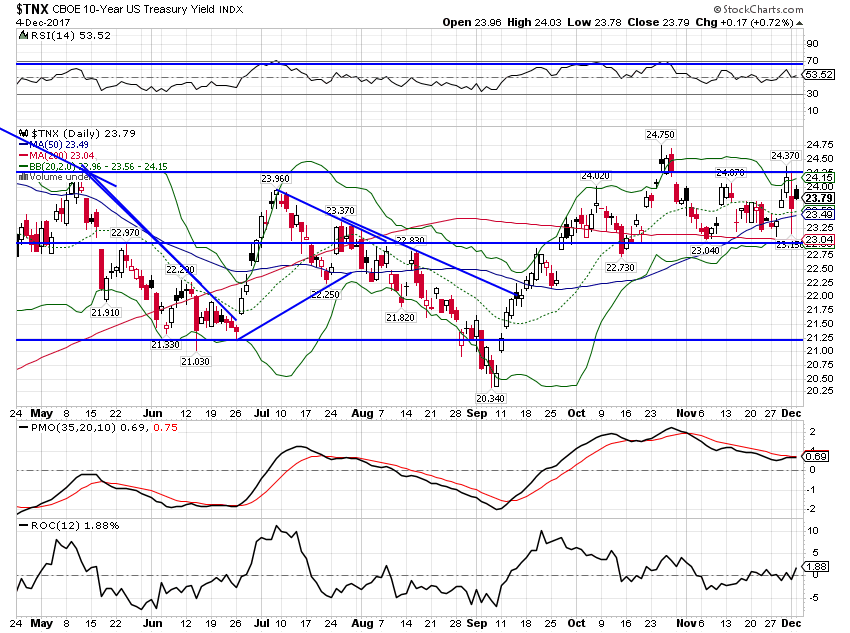
The problem is that the other markets we monitor – which actually have a much better track record at predicting growth than stocks – are not participating. It is what Alan Greenspan and Ben Bernanke would call a conundrum. The Fed is busy hiking rates and shrinking its balance sheet (well promising to at least) because they see an economy at full employment and inflation that will be jumping just as soon as the Philips Curve really kicks in. And, now they have the added incentive to get moving on those rate hikes because Congress has passed a huge – huge I say – tax cut that will expand the deficit and produce even more growth. At least that’s the Keynesian theory, although the Republicans are selling this as more of a supply-side, Laffer curve, self financing tax cut. Personally, I think the Keynesian and Laffer adherents are both wrong. We are not that far right on the Laffer curve and more debt at this point isn’t the answer. The S&P 500 was up about 1.5% last week – 40 S&P points aren’t what they used to be – as the tax bill worked its way through the Senate. It is always hard to say exactly why a market is moving – how do you discern the motives of millions of individuals? – but it seemed as if every time another Senator committed to voting yes, stocks took another leg higher. So, it certainly seemed as if the stock market was responding to the changing fortunes of the tax bill. But bonds barely budged last week, the 10 year Treasury up a mere 2 basis points on the week. Indeed, Treasuries are little changed over the course of the entire year although the 10 year yield is up about 50 basis points since the election. But the hope of a new administration has been fading all year even as the tax bill looks to be heading for inevitable passage. |
US 10 Year Treasury Yield, May - Dec 2017 |
| If the data really is improving and the tax bill is going to pass, why isn’t the bond market reacting more? Why aren’t long term interest rates moving up with short term rates as the Fed prepares the market for more rate hikes? That is the original conundrum which Greenspan essentially chalked up to the market being wrong about growth and him being right. We know how that turned out. This episode is somewhat different in that we have the complicating factor of two hurricanes to deal with. The impact of natural disasters is negative – destroying things at random is not a growth strategy – but it isn’t always obvious in the ebb and flow of the high frequency economic data. The recent data, primarily from October, likely reflects spending on hurricane recovery that would not have happened otherwise. In other words, the data has indeed been somewhat better recently but it may not be sustainable. Is that why the bond markets haven’t responded more to a Citi surprise index at multi-year highs?
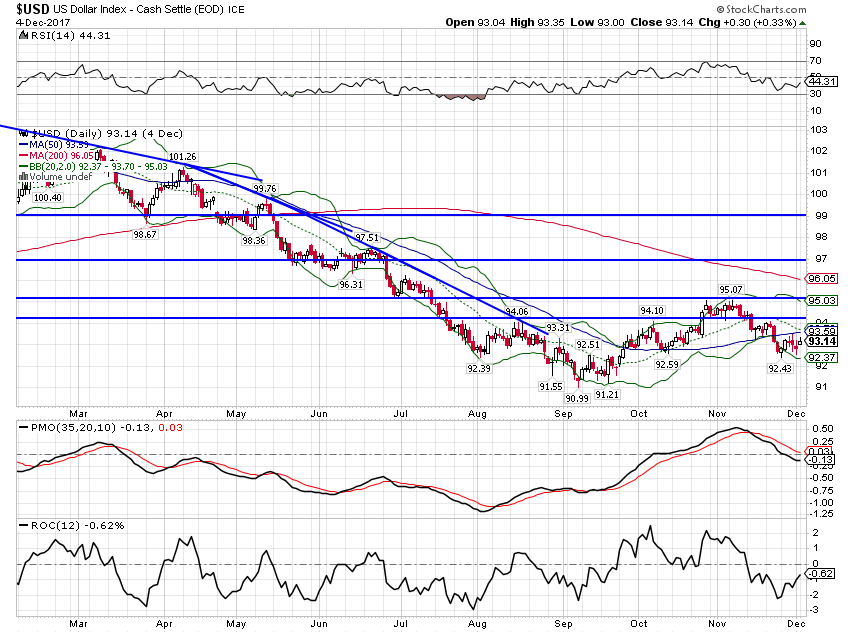
What about the tax bill? If it is as positive for growth as its backers claim why aren’t bond and currency markets responding more? It isn’t just the Treasury market that hasn’t responded to the passage of the bill. The dollar has not strengthened as one would expect if the cut in the corporate tax rate was about to spur a surge in US based investment. If companies are going to repatriate a bunch of capital supposedly trapped overseas, why isn’t the dollar rising? The obvious answer to the second question is that most of the money is already here. Apple doesn’t have a vault somewhere in Ireland where they stash a bunch of Euros, Pounds and Dollars; that offshore capital, or a large part of it, is already invested in the US via the corporate bond market. As for the dollar overall, there are many things that influence an exchange rate and interest rates – or growth expectations, flip sides of the same coin really – are just one. The President has repeatedly expressed a preference for a weak dollar and his Treasury Secretary hasn’t disputed the notion. And the trade front looks like an endless list of disputes over everything from airplanes to steel to aluminum. Is trade and dollar policy undermining the tax cuts? Is the weaker dollar a problem? It seems to me that, at a minimum, a stable currency would be desirable for a country trying to attract investment as the US is. If the hurdle rate on an investment project has to include an assumption about currency losses it is already in trouble. So, yes, certainly a falling dollar would not be conducive to or consistent with capital inflows to the US. Tax cuts just don’t work as well with a weak dollar, the last Bush administration being exhibit 1 if you have doubts about that statement. |
US Dollar Index, March - Dec 2017(see more posts on U.S. Dollar Index, ) |
| The conundrum is expressed through the yield curve which has been flattening. Contrary to the many articles I’ve seen recently, this does not mean recession is imminent. Contrary to all the other articles I’ve read recently, it can’t be dismissed either; it isn’t different this time. The movement of the yield curve tell us that long term bonds are not buying the tax cut growth story. Or it isn’t buying the Fed’s justifications for hiking rates. Or both. The signal for recession will be when the curve starts to steepen rapidly when it turns out that, once again, the market is right and the Fed is wrong. But we aren’t there yet. |
10 Year Constant Maturity |
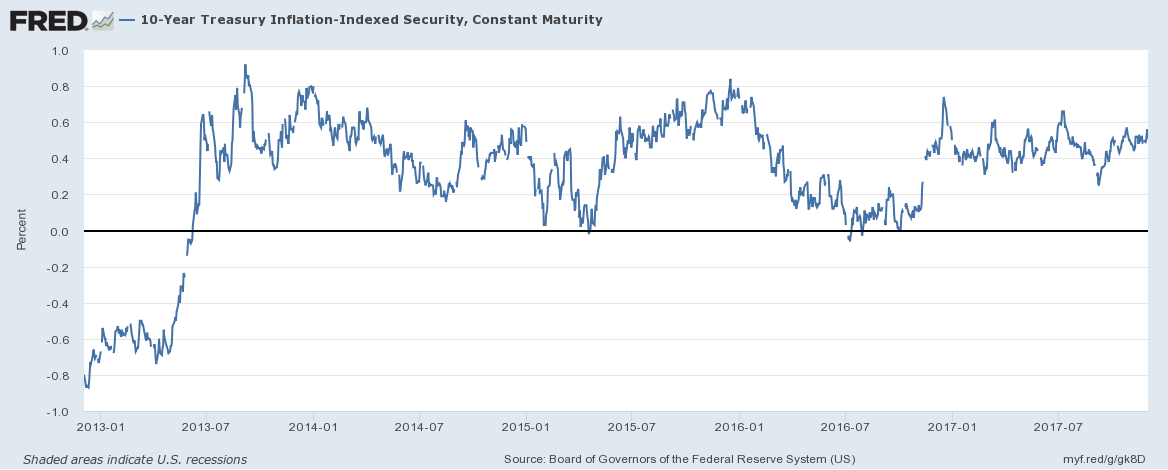
| Real interest rates are telling a similar story with short term rates rising and long term rates steady. Over the last two weeks the 10 year TIPS yield rose by 2 basis points, the same as the nominal bond. The 10 year real yield is in the same range it has been in since 2013; real growth expectations have fluctuated in a narrow and low range that entire time. |
10 Year Treasury Inflation - Indexed Security, Jan 2013 - Jul 2017 |
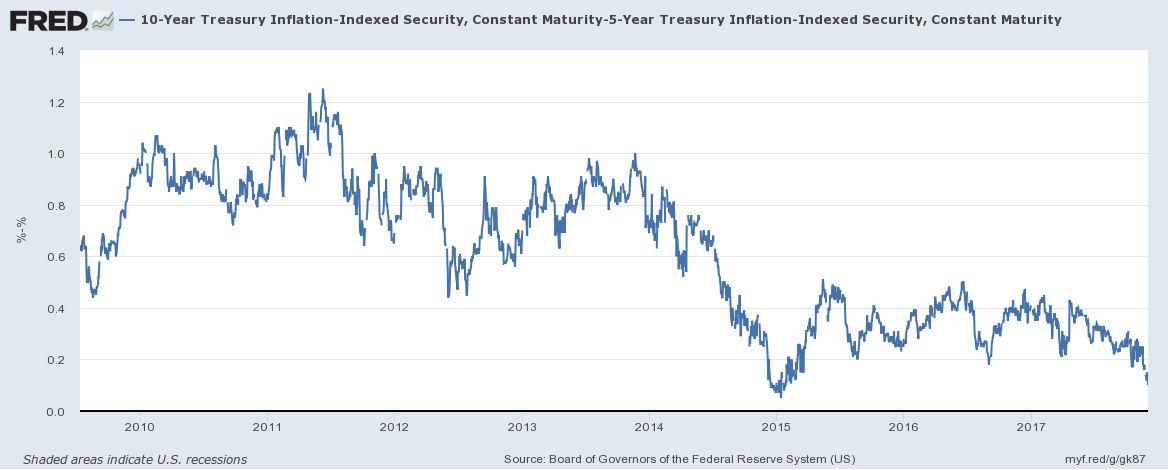
| The 5 year version rose 10 basis points and the difference between the two is now just 10 basis points. Here’s your flat curve: |
10 Year Treasury Inflation - Indexed Security, 2010 - 2017 |
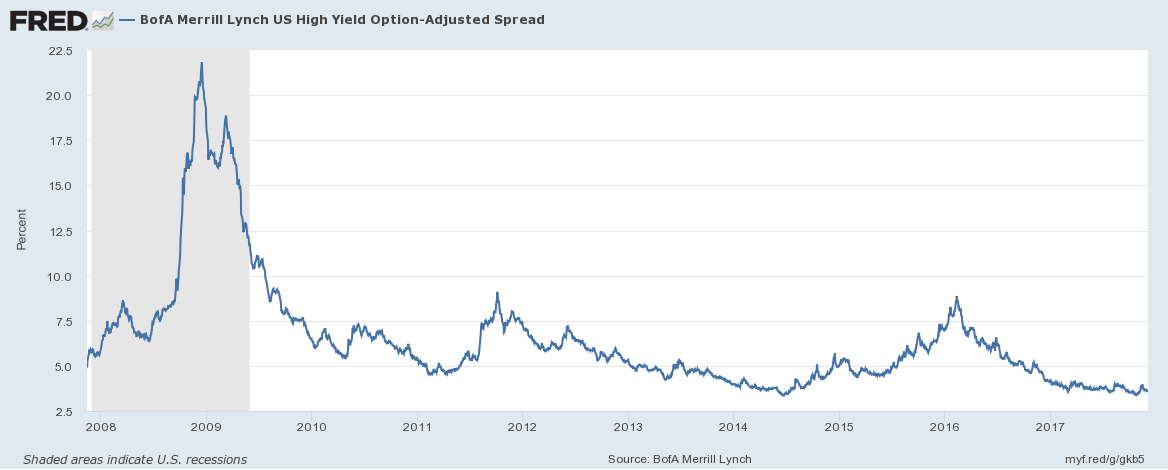
| Credit spreads narrowed after a very brief widening that never rose to a level that meant anything other than routine profit taking. Growth expectations aren’t improving but spreads confirm they aren’t getting worse either. |
BofA Merrill Lynch High Yield Option, 2008 - 2017 |
| Commodity markets tell a similar if somewhat mixed growth story. The Copper:Gold ratio has stalled, trading sideways over the last month and showing little reaction to the passage of the tax bill. |
Copper : Gold Continuous Contract, May - Dec 2017 |
| Gold hasn’t moved much either. One would expect gold to fall if growth were expected to accelerate. |
Gold Daily, May - Dec 2017 |
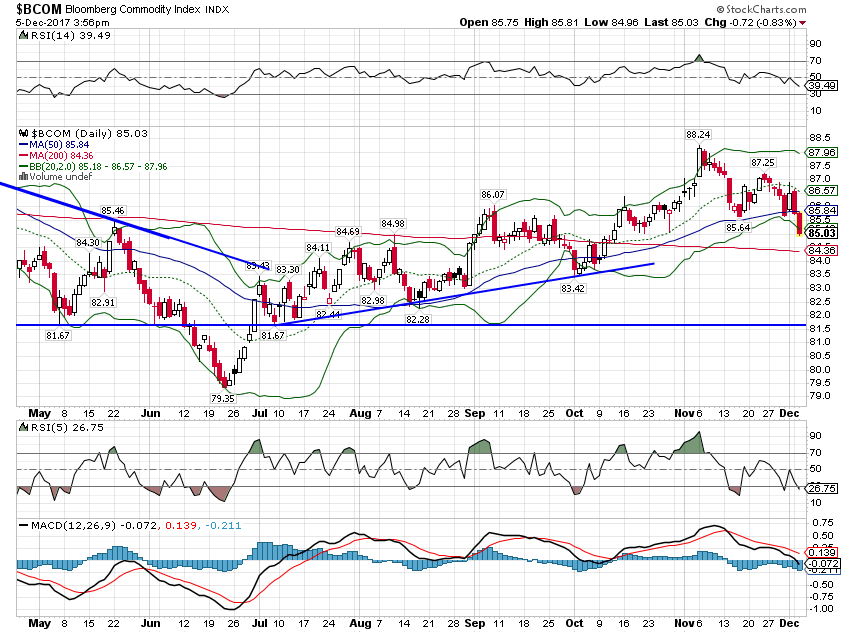
| But commodities more generally have pulled back, selling off even as the tax bill moved through the Senate. One would expect a weaker dollar to be supportive of commodity prices but growth plays a role too. |
Bloomberg Commodity Index, May - Dec 2017 |
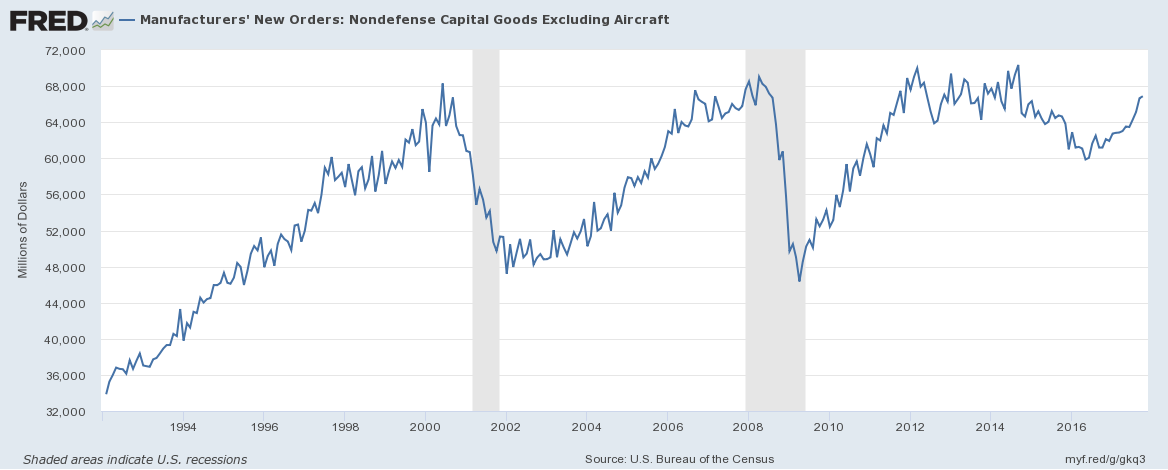
| The stock market euphoria over the tax bills may eventually prove prophetic but there is no evidence in other markets to back it up right now. The economic data of the last two weeks was not bad but it is still distorted by the bounce back from the hurricanes. That will fade soon though and I expect we’ll be right back where we’ve been for some time now – smack dab in the middle of mediocre. Even now, after two consecutive quarters of 3% growth, year over year growth in GDP is just 2.3%. Employment growth is slowing, the yield curve is flattening. Personal income, reported last week, was boosted by, of all things, interest income, with wages and salaries actually down 0.2% from September. The durable goods report was weak, the hurricane replacement effect seemingly starting to fade already. Within that report, core capital goods orders were down on the month but up 8.1% year over year, which sounds great. Until you see this chart: |
Manufacturers' New Orders, 1994 - 2017 |
| This is secular stagnation in a nutshell. Those core capital goods orders may have climbed smartly over the last year but the total is still shy of the peak – in June of 2000. Investment is the swing voter of the economic world, the marginal change that puts us in and takes us out of recession. The just passed tax bill attempts to change this by reducing the corporate tax rate but lack of profits does not seem to be the source of our investment problem.
Profits and profit margins are already near all time highs and that hasn’t induced companies to invest. Corporate taxes are not the limiting factor in our low growth world and cutting them seems unlikely to solve the problem. Or at least that is what all the markets other than stocks are saying. So who you gonna believe? The bond market or the stock market? The dollar or the politicians? The commodity markets or the Fed? |
Corporate Profits After Tax with Inventory Valuation, 1950 - 2017 |
Tags: Alhambra Research,Bi-Weekly Economic Review,commodities,Copper,credit spreads,economic growth,economy,Federal Reserve/Monetary Policy,Gold,inflation,Interest rates,Markets,newslettersent,tax reform,Taxes/Fiscal Policy,treasuries,U.S. Dollar Index,US dollar,Yield Curve


