George Dorgan
My articles My siteAbout meMy videosMy books
Follow on:LinkedINTwitterSeeking Alpha
CFA SocietyEconomicBlogs
Premium growth from 2016 to 2017 dampens the development of disposable income by 0.3 percentage points
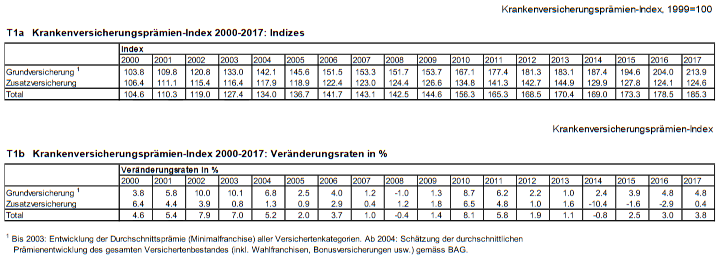
Neuchâtel, 24.11.2017 (FSO) – The health insurance premiums index (CIPI) recorded a growth of 3.8 percent over the previous year for the 2017 premium year. The KVPI thus achieved an index level of 185.3 points (base 1999 = 100). The impact of premium development on the growth of disposable income can be estimated using the CIPI. According to the KVPI model calculation by the Federal Statistical Office (FSO), the increase in premiums reduces the growth in average disposable income in 2017 by 0.3 percentage points.
The KVPI covers the premium development of compulsory health insurance and sickness insurance. The premiums for basic health insurance increased by 4.8 percent in 2017, reaching an index level of 213.9 points (base 1999 = 100). This estimate corresponds to the premium development of the total number of insured persons on average.
Premiums for supplementary health insurance increased in 2017 by 0.4 per cent compared to the previous year. Premiums for general supplementary hospital insurance fell by 0.4 per cent, while those of semi-private patients rose by 0.9 per cent and those of private supplementary hospital insurance by 0.3 per cent. For the additional insurance as a whole, this results in an index level of 124.6 points for the premium year 2017 (base 1999 = 100).
According to the FSO estimate, the development of health insurance premiums reduces the potential growth of the estimated average disposable income between 2016 and 2017 by 0.3 percentage points. If the premiums had remained stable during the same period, this money would have been available to households for consumption or saving purposes.Premium increases weigh on household budgets, similar to higher taxes or other insurance premiums. To measure this effect, the influence on disposable income is appropriate. It is equal to income (earned income, interest, pensions, reimbursements and subsidies for insurance and other income) less the so – called transfer payments (eg taxes, social and other insurance contributions) – the amount that is effectively available for consumption and saving purposes.
Prämienwachstum von 2016 bis 2017 dämpft die Entwicklung der verfügbaren Einkommen um 0,3 Prozentpunkte
Neuchâtel, 24.11.2017 (BFS) – Der Krankenversicherungsprämien – Index (KVPI) verzeichnet für das Prämienjahr 2017 ein Wachstum von 3,8 Prozent gegenüber dem Vorjahr. Der KVPI erreicht damit einen Indexstand von 185,3 Punkten (Basis 1999=100). Anhand des KVPI lässt sich die Auswirkung der Prämienentwicklung auf das Wachstum des verfügbaren Einkommens schätzen. Gemäss der KVPI – Modellrechnung des Bundesamts für Statistik (BFS) reduziert die Prämiensteigerung das Wachstum des verfügbaren Durchschnittseinkommens 2017 um 0,3 Prozentpunkte.
Der KVPI erfasst die Prämienentwicklung der obligatorischen Krankenpflegeversicherung und der Krankenz usatzversicherung. Die Prämien für die Krankengrundversicherungen sind 2017 um 4,8 Prozent gestiegen und erreichen damit einen Indexstand von 213,9 Punkten (Basis 1999=100). Diese Schätzung entspricht der Prämienentwicklung des gesamten Versichertenbestand es im Durchschnitt.
ie erhobenen Prämien für die Krankenzusatzversicherungen stiegen 2017 um 0,4 Prozent gegenüber dem Vorjahr. Dabei sinken die Prämien der allgemeinen Spitalzusatzversicherung um 0,4 Prozent, während jene der halbprivaten um 0,9 Prozent und jene der privaten Spitalzusatzversicherung um 0,3 Prozent ansteigen. Für die Zusatzversicherung insgesamt ergibt dies für das Prämienjahr 2017 einen Indexstand von 124,6 Punkten (Basis 1999=100).
Prämienentwicklung beeinflusst das verfügbare Einkommen
Die Entwicklung der Krankenversicherungsprämien verringert gemäss der BFS – Schätzung das potenzielle Wachstum des geschätzten verfügbaren Durchschnittseinkommens zwischen 2016 und 2017 um 0,3 Prozentpunkte. Wären die Prämien im gleichen Zeitraum stabil geblieben, hätte dieses Geld den Haushalten zusätzlich für Konsum – oder Sparzwecke zur Verfügung gestanden.Prämienerhöhungen belasten – ähnlich wie höhere Steuern oder andere Versicherungsbeiträge – das Budget der privaten Haushalte. Zur Messung dieses Effekts bietet sich der Einfluss auf das verfügbare Einkommen an. Es entspricht dem Einkommen (Erwerbseinkommen, Zinsen, Renten, Rückerstattungen und Verbilligungen der Versicherungen und sonstige Einkommen) abzüglich der so genannten Transferzahlungen (beispielsweise Steuern, Sozial – und sonstige Versicherungsbeiträge) – also dem Betrag, der effektiv für Konsum – und Sparzwecke zur Verfügung steht.
Schweiz Krankenversicherungsprämien 2000-2017
- Click to enlarge
Tags: newslettersent