Charles Hugh Smith
My articles My offerMy siteAbout meMy videosMy books
Follow on:TwitterFacebookYoutubeAmazon
There’s a profound difference between assets that produce no income and those that produce net income.
To those of us nutty enough to pore over dozens of pages of data on wealth and income in the U.S., the Federal Reserve’s quarterly Z.1 reports and annual Survey of Consumer Finances (SCF) are treasure troves, as are I.R.S. tax and income reports.
Allow me to share a few observations on family wealth and income drawn from my review of these documents:
Financial Accounts of the United States (198 pages)
Corporate profits clock in at $2.135 trillion annually, around 11% of the nation’s GDP (gross domestic product). (Page 10 of Z.1) This has changed very little over the past few years; corporate profits totaled $2.140 trillion in 2014.
Most people who follow financial matters closely probably know corporate profits have been around $2 trillion annually for awhile.
But how many know that proprietors’ income from small businesses ($1.375 trillion) and rental income of persons–i.e. not corporations–($740 billion) together equal corporate profits? ($2.115 trillion for small biz/rentals, $2.135 trillion for corporate profits.
How many financially savvy people know that proprietors’ income and private rental income rose by $189 billion since 2014, while corporate profits flatlined?
Clearly, the families that own the proprietorships and rentals pulling down $2.1 trillion in annual profits are doing a bit better than OK.
As the charts below reveal, most of this profitable business equity is owned by the top 10% of families. There are a few clues that suggest that family-owned business equity is distributed along a power-law curve, i.e. the majority of wealth and income is held by the top and the rest is distributed over the rest of the owners.
On Page 28 of the Survey of Consumer Finances (SCF), we find that the business equity owned by families in the bottom 50% of family incomes has a mean value of $208,000, up marginally from $204,000 in 2010, the business equity held by the top 10% of families rose from $2.265 million in 2010 to $3.3 million in 2016–a gain of over $1 million.
As always, I want to stress the profound difference between assets that produce no income and those that produce net income. This excludes hobby businesses that lose money or tax shelters that are intended to lose money. I’m talking about businesses that generate revenues in excess of all expenses: net profit that is taxable.
Owning a vacation home that is rented out a few weeks a year is one thing, owning a rental property that’s rented out 50 weeks a year is considerably different. The first is an expense, the second generates net income.
Somewhat to my surprise, almost 14% of households own some residential property equity other than their primary residence (page 18 of the SCF). Unfortunately, the Fed lumps second homes and vacation properties in with rental properties of up to 4 units, while rentals with 5 or more units are lumped in with farmland and commercial properties in equity in nonresidential property.
Only 6% of households own any equity in nonresidential property, a category of wealth that gained 72% from 2013 to 2016. Interestingly, the percentage of families owning this form of wealth actually declined from 7.2% in 2013 to 6.2% in 2016, suggesting to me that the corporations and hedge funds snapping up multi-unit residential properties are buying properties from families.
Based on my previous surveys of I.R.S. income tax data, much of this small-business equity and family owned-rental property is owned by the top 4% to 5% of families, with the majority owned by the top 10%, as shown in the chart below.
| The number of families with business equity has been declining, eroded by recession and stagnation, despite the recent bounce higher. |
Percent of Families with business equity, 1989 - 2016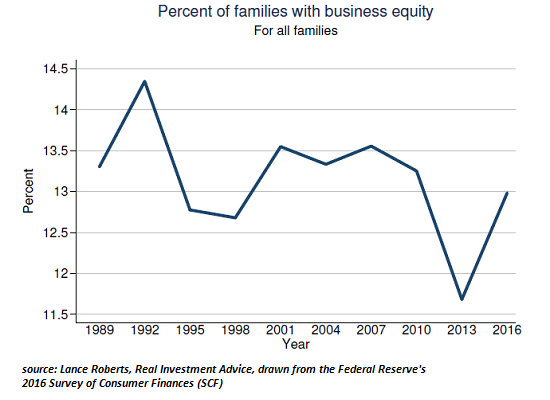 - Click to enlarge |
| Most of the biz-equity is owned by the top 10%: |
Mean Value of Business Equity for Families with Holdings, 1989 - 2016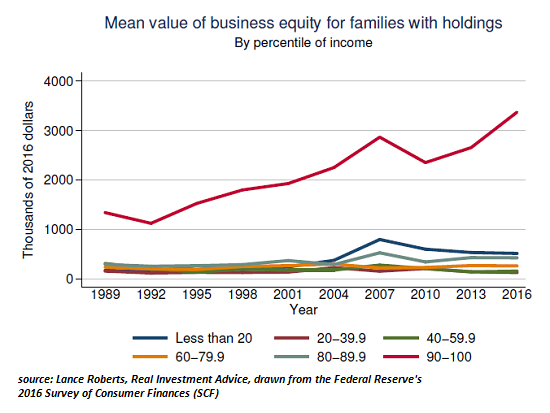 - Click to enlarge |
While the financial media focuses on billionaires and hedge fund managers playing for billions, much of the wealth and income of the nation is firmly in the hands of families that own proprietorships and rental properties.
These assets have risen sharply in value, and they’ve also generated gains in income.
If you want to get rich, you can climb into a time machine, return to 2010 and buy a couple thousand bitcoin for $1 each. Alternatively, you can marry extremely well. If neither of these options is available, then starting a profitable proprietorship that enables the purchase of rental properties is another option.
My new book is The Adventures of the Consulting Philosopher: The Disappearance of Drake. For more, please visit the book's website.

At readers' request, I've prepared a biography. I am not confident this is the right length or has the desired information; the whole project veers uncomfortably close to PR. On the other hand, who wants to read a boring bio? I am reminded of the "Peanuts" comic character Lucy, who once issued this terse biographical summary: "A man was born, he lived, he died." All undoubtedly true, but somewhat lacking in narrative.
Tags: newslettersent