Pater Tenebrarum
My articles My siteAbout meMy videosMy books
Follow on:TwitterSeeking AlphaFacebook
A Big Reference Chart CollectionOur friends at Incrementum have created a special treat for gold aficionados, based on the 2017 “In Gold We Trust Report”. Not everybody has the time to read a 160 page report, even if it would be quite worthwhile to do so. As we always mention when it is published, it is a highly useful reference work, even if one doesn’t get around to reading all of it (and selective reading is always possible, aided by the table of contents at the beginning). |
S&P 500 Large Cap Index, June 2000 - Oct 2017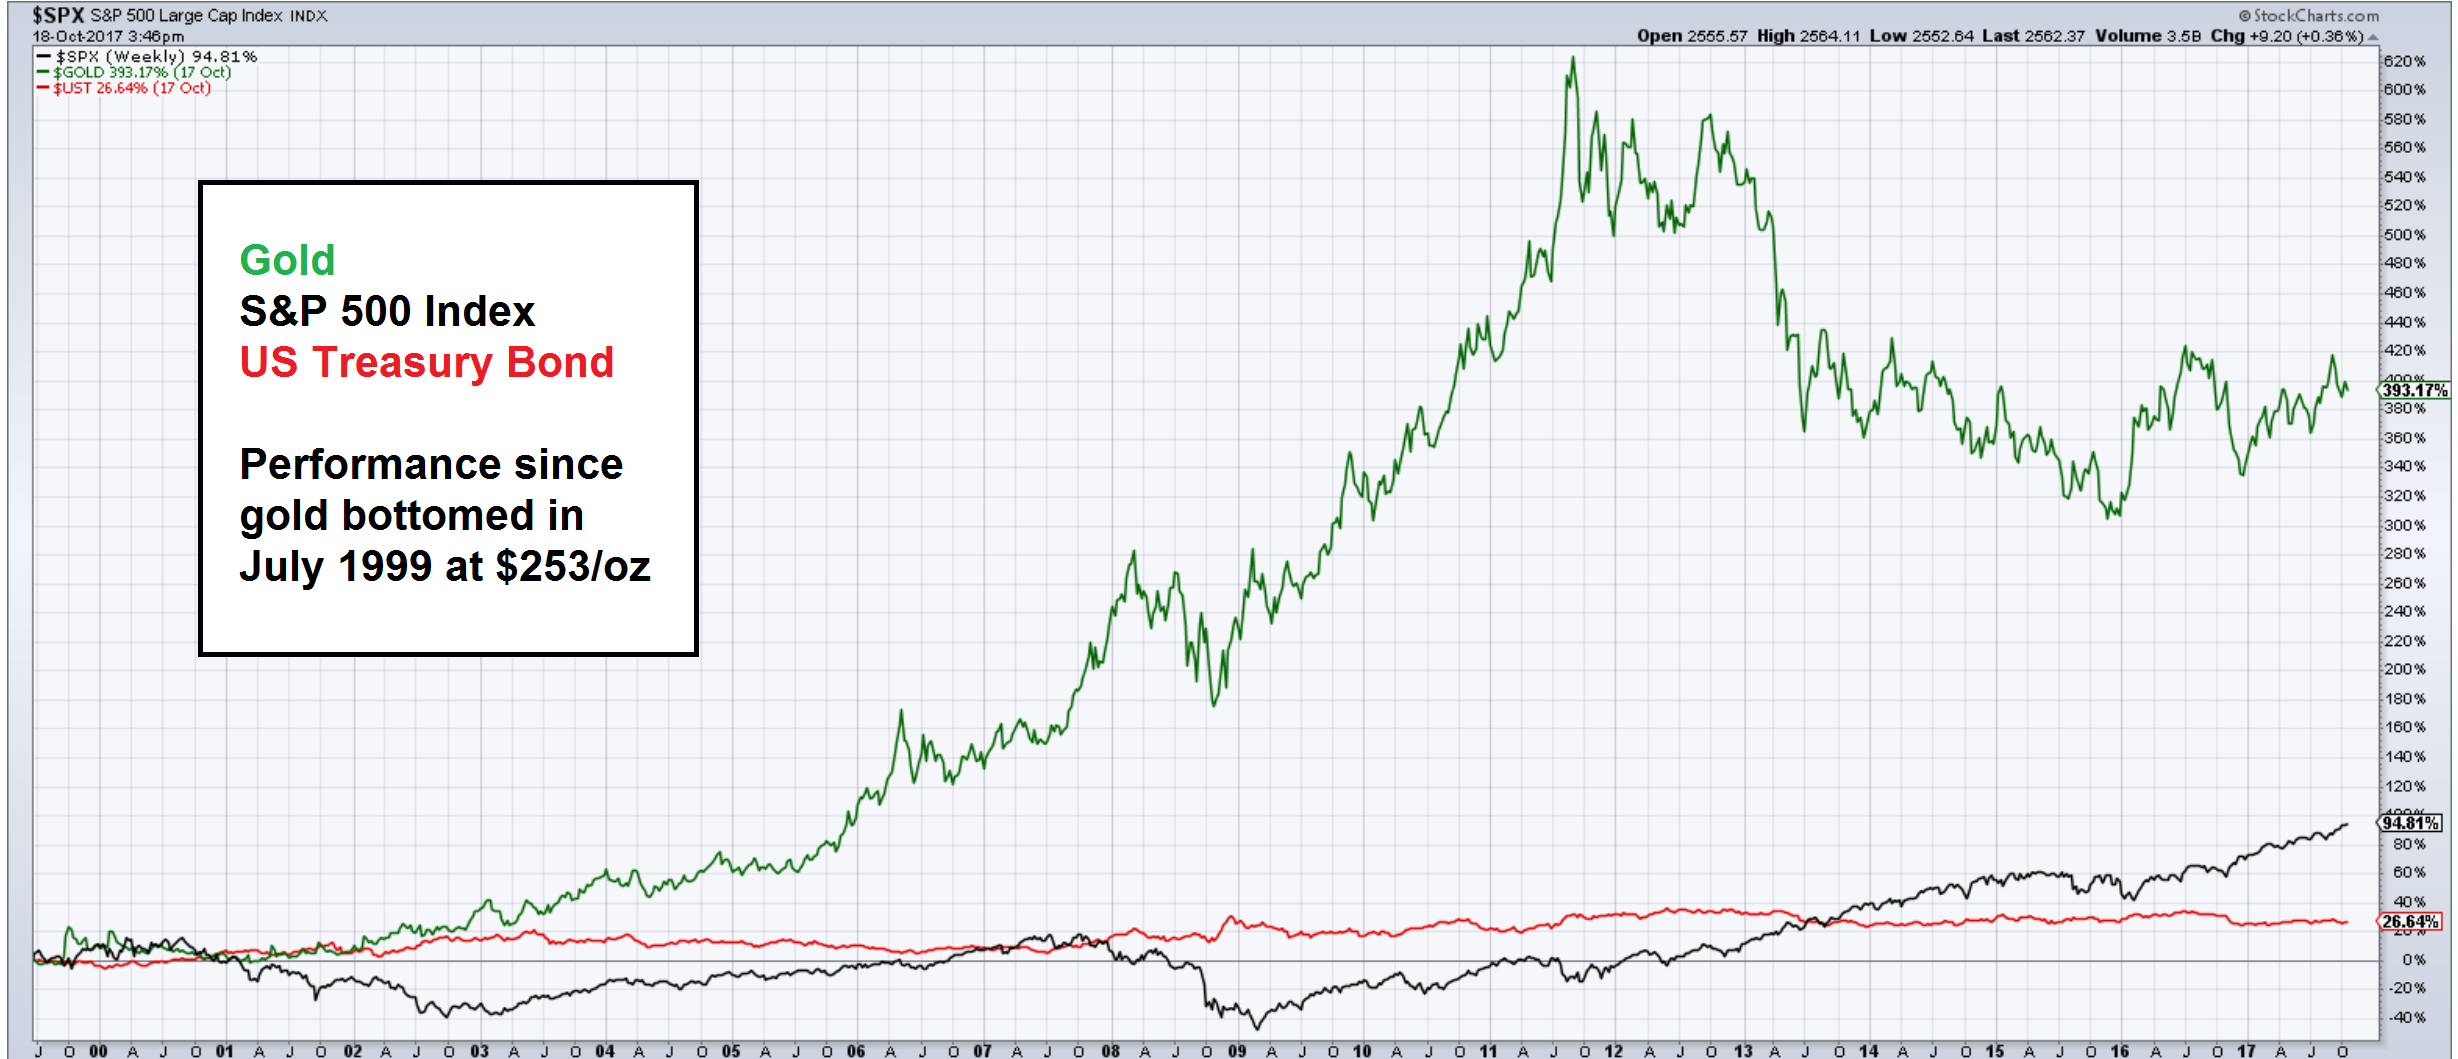 The performance of major asset classes since gold bottomed in July of 1999. Despite the stock market outperforming gold handily since 2011, it is still lagging behind quite a bit over the past two decades. - Click to enlarge So it is clear what one should rather have owned. As far as we are concerned, for a variety of reasons we do not believe that gold’s secular bull market is over just yet, despite the steep correction from 2011 – 2015 (or 2013 in terms of most non-dollar currencies). The beginning of the new uptrend (gold is already up about 25% from its low) is in many ways reminiscent of the beginning of the bull market, as it is a halting affair with many short term setbacks, accompanied by great skepticism. The current year is particularly remarkable, because gold had every reason to decline, but up until recently had actually outperformed every other major asset class (the stock market only managed to catch up with it very recently). Gold has begun to strengthen ever since the Fed’s rate hike campaign began – regular readers may recall that we expected this to happen and asked them to “bring it on”. This is counter-intuitive and the consensus certainly expected the exact opposite outcome. In reality it is both logical and telling. As an aside: if we had added the CRB to this chart, you would see that it has actually lost 3.2% since July of 1999. We refrained from adding it because the CRB does not properly depict the price performance of commodities. Its performance includes the futures roll-over effect, which leads to huge distortions over time. A spot price index looks completely different and would show a respectable gain in commodity prices since 1999 (and it should be obvious that with crude oil trading at $50 instead of $10 and copper nearly at $3 instead of 40 cents, etc., that commodities are generally definitely not cheaper than in 1999/2000). Unfortunately we couldn’t find such an index at stockcharts, so we decided to rather leave commodities out |
| Taking the reference idea a step further, Ronnie and Marc have extracted all the charts presented in the report and collected them in a separate chart book, which we hereby make available as a download in PDF format (the link is at the bottom of this article).
It is probably no exaggeration to call it the most comprehensive collection of gold charts available anywhere. All kinds of historical charts, comparisons, ratio charts, etc., can be found in it, including obscure but quite fascinating charts such as the one showing how many liters of beer an ounce of gold would have bought at the annual October Fest in Munich over time. |
Gold:Beer Ratio, 1950 - 2010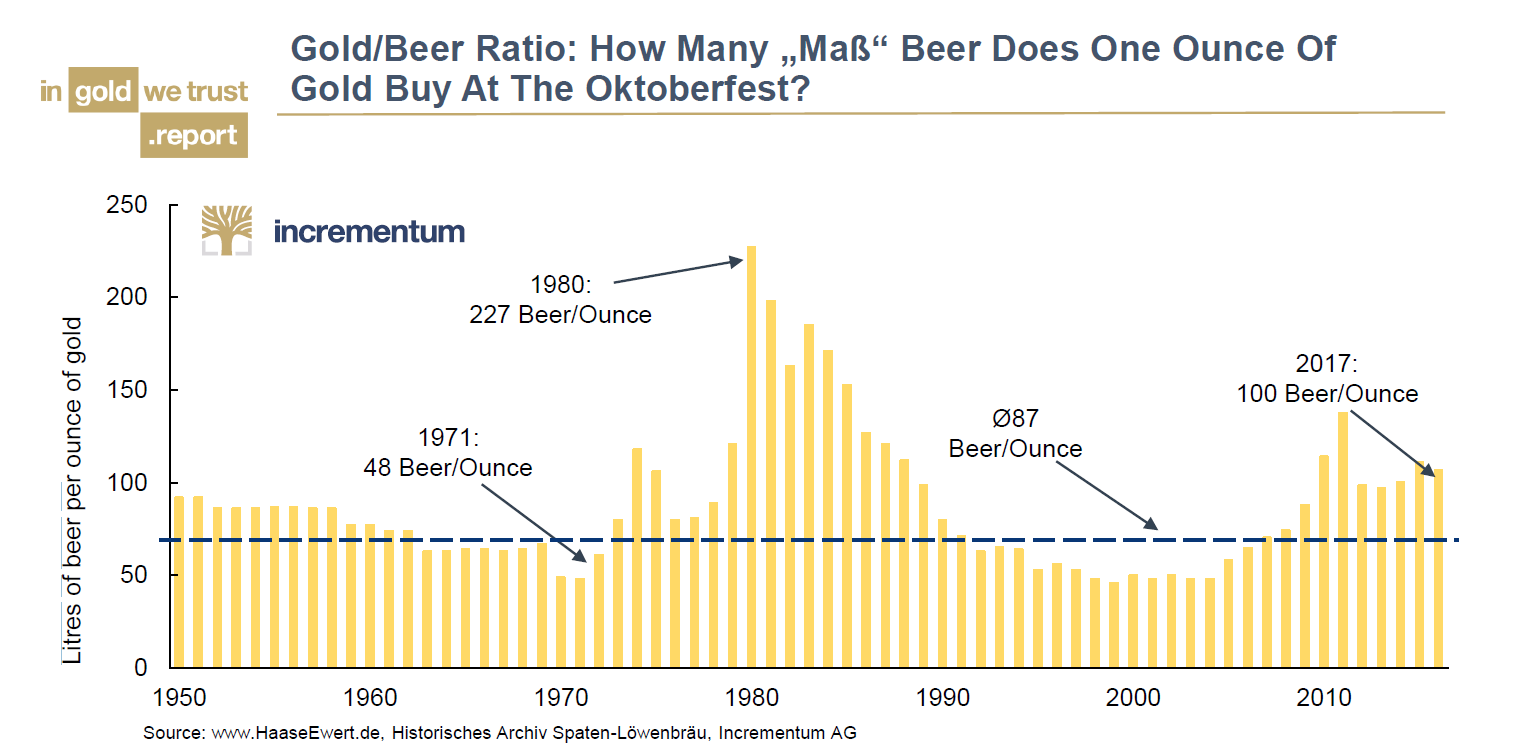 The gold-to-beer ratio – or how gold would have preserved the purchasing power of beer drinkers since 1950 - Click to enlarge |
It seems that saving one’s beer money in the form of gold would have been a good long term decision, even if there were a few times when that didn’t seem to be the case. The important point is that gold does preserve purchasing power in the long run, which is precisely what one would expect on theoretical grounds.
Without further ado, here is the download link to this excellent chart book:
Chart Book “In Gold We Trust” 2017 (pdf)
Enjoy!
Charts by: StockCharts, Incrementum
Full story here Are you the author?Tags: newslettersent,Precious Metals