Recurring PhenomenaMany market participants believe simple phenomena in the stock market are purely random events and cannot recur consistently. Indeed, there is probably no stock market “rule” that will remain valid forever. However, there continue to be certain statistical phenomena in the stock market – even quite simple ones – that have shown a tendency to persist for very long time periods. In today’s report I examine such a phenomenon: namely, the performance of the S&P 500 Index on individual days of the week. |
US S&P 500 Large Cap Index(see more posts on S&P 500, )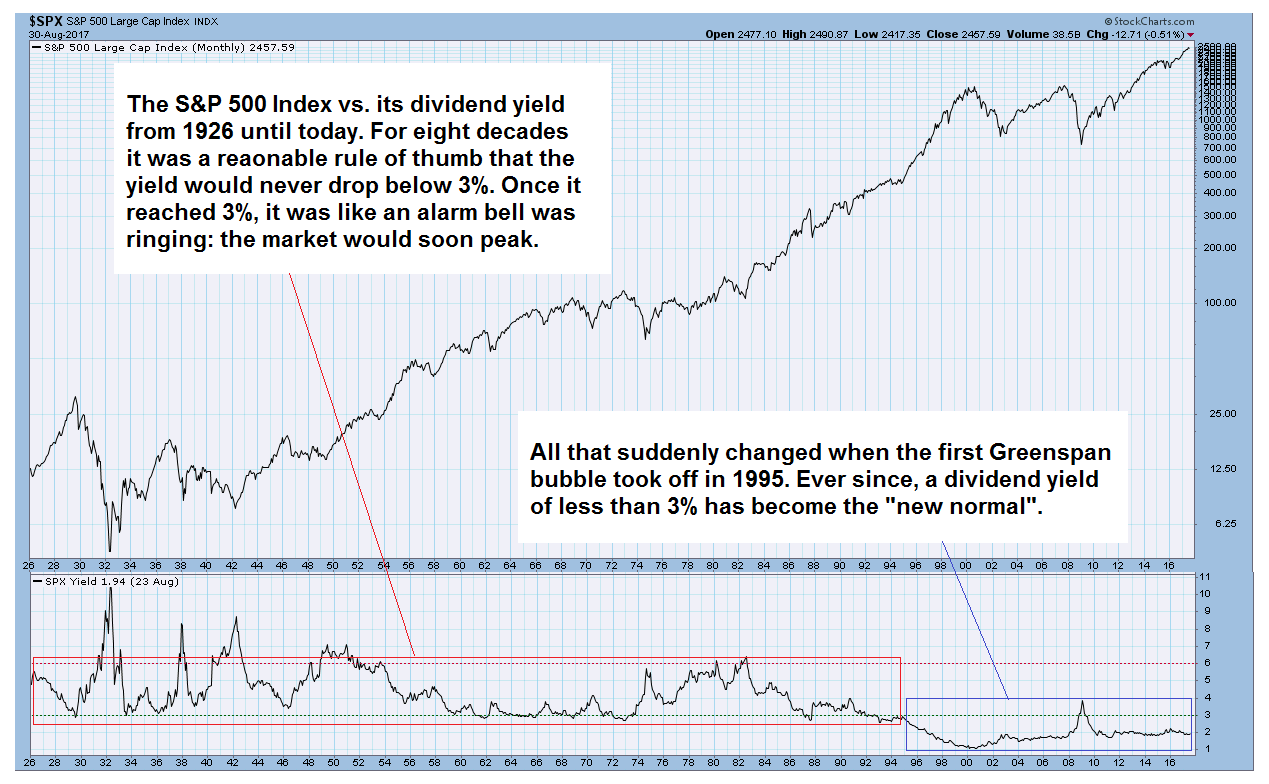 This chart illustrates a “rule that changed” – for eight decades (actually longer, but on this chart we can see the final eight decades during which the rule applied) the dividend yield on the S&P 500 Index would never fall much below 3%. Whenever that level was reached, everybody knew a correction or a bear market was imminent. This changed profoundly in the mid 1990s. The culprit: massive monetary inflation. - Click to enlarge |
Tuesday is a Particularly Strong Trading Day, Friday a Weak OneThe chart below shows the annualized performance of the S&P 500 Index since the turn of the century in black, as well as the cumulative annualized return generated on individual days of the week in blue. I have measured the price changes from close to close; thus the performance of e.g. Tuesday represents the difference between the closing level on Monday and the closing level on Tuesday. As you can see, two days are standing out in terms of positive performance: Thursday, and especially Tuesday. The cumulative return of the stock market on Tuesdays alone was actually better than the cumulative return achieved on all five trading days combined! By contrast, Friday was on average quite weak. On Mondays and Wednesdays the market by and large tended to move sideways on average. What do these data look like in specific market environments though, i.e., during bull and bear market periods? |
US S&P 500 Index, 2000 - 2017(see more posts on S&P 500 Index, )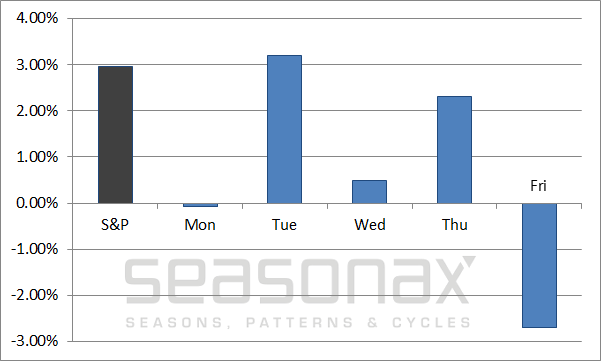 S&P 500 Index, performance by individual days of the week, 2000 to 2017 – annualized. Friday is on average a down day. - Click to enlarge |
The Days of the Week Under the MicroscopeThe next chart shows the performance of the S&P 500 Index since the turn of the century in black, as well as the cumulative return achieved on individual days of the week in other colors – all indexed to 100. Take a close look at the performances during the bear market after the year 2000 peak and in the course of the 2008 financial crisis. Even in these otherwise difficult times for the market, Tuesdays (red) and Thursdays (blue) delivered pretty decent results. In 2008, the cumulative return generated on Tuesdays was actually significantly positive, in the face of an extremely bearish market trend! In short, these two trading days are indeed rather extraordinary. |
US S&P 500 Index, 2000 - 2017(see more posts on S&P 500 Index, ) S&P 500 Index, cumulative returns by day of the week, 2000 – 2017, indexed. Even in 2008 investing exclusively on Tuesdays ended up generating a gain! - Click to enlarge |
Combinations Improve Results
By investing only on Tuesdays, one would have been able to outperform the market over the entire period examined above. However, in rally periods, such as e.g. the rally beginning in 2009, the cumulative return achieved on Tuesdays lagged behind that of the trading week as a whole.
That should actually be expected, as strong gains require longer investment periods, and being invested just 20 percent of the time is simply unlikely to be enough.
This problem can be addressed by implementing combinations. As already illustrated by the first chart, overall, the S&P 500 Index has gained 2.95% annualized since 2000, while the cumulative gain of all trading sessions on Tuesdays was 3.19%.
Combinations can make a very big difference though. Investing on Tuesdays and Thursdays combined would have generated an annual return of 5.52%. If one had additionally sold the market short on Fridays, the annualized gain would have improved to 8.07% – definitely an excellent result!
Combining Independent Factors Will Lead to More Stable and Reliable Returns
Alas, there is a drawback to this combination strategy as well: the returns generated on individual days of the week are interdependent. For instance, it may well happen that at some point in the future, in an otherwise slightly uptrending stock market, Tuesdays and Thursdays no longer deliver a strong return over the entire investment period, but turn out to be weak instead.
If that were to happen, it would be highly unlikely that the returns generated on Fridays would remain as weak as they have been to date. In short, all three partial components of the strategy would then exert an unfavorable effect on the overall investment result.
From a statistical perspective, it is therefore as a rule better to combine independent factors, such as those that can be found with the help of the Seasonax app (available on Bloomberg and/or Thomson-Reuters). The probability that what was valid in the past will continue to be valid in the future is higher that way.
PS: For now, you can probably relax on Mondays and enjoy the action on Tuesdays!
Charts by StockCharts, Seasonax
Full story here Are you the author?Tags: newslettersent,S&P 500,S&P 500 Index,The Stock Market