| The first few days of any calendar month are now flooded with PMI data. Mostly due to Markit’s ongoing and increasing partnerships, we now have access to economic or business sentiment from and for almost anywhere in the world. It isn’t clear, however, if that is a good or useful development.
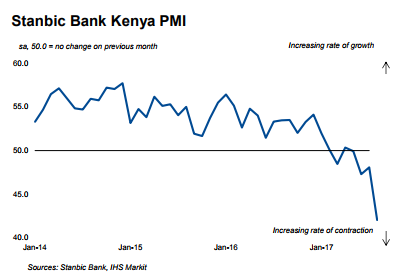
For example, we can see quite plainly that there is a whole bunch of trouble brewing in Kenya. The Stanbic Bank/Markit Kenya PMI fell to a record low 42.0 in August (the index history start only in 2014). Since late last year, sentiment has turned more and more negative mostly on political turmoil. There was first a tense election campaign culminating in a vote last month whose results were then nullified by the country’s Supreme Court. |
Stanbic Bank Kenya PMI, Jan 2014 - 2017 |
| Whereas that particular PMI might most visibly match the general economic circumstance, the rest of the PMI’s this month for last month have been more mixed – often in the same country (or continent) at the same time.
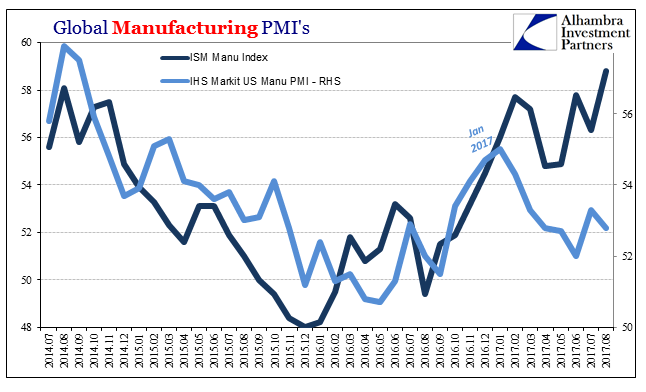
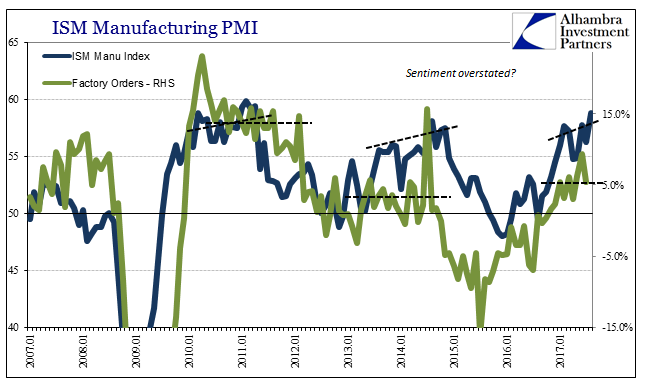
Before Markit’s big entry into the economic data business, there was the Institute for Supply Management (ISM). Its sentiment survey has a very long track record and is often given serious weight in the most orthodox models (at least it was until 2015 when it started to suggest the “wrong” direction). The ISM’s Manufacturing Index PMI shot up to 58.8 for August 2017. That was the highest index value since a bunch of 59’s in the summer of 2011 (just before that downturn would form). It was slightly better than the peak in 2014. Markit’s US Manufacturing PMI, however, is at the other end of the spectrum in August. That particular sentiment index remains near recent lows, more 2016 than what 2017 was thought to be. Unlike the ISM, this version turned lower and quite sharply at the start of this year and has yet to suggest anything more than that. |
US Global Manufacturing PMI's, Jul 2014 - Aug 2017(see more posts on U.S. Manufacturing PMI, ) |
| The two are not going to agree exactly on manufacturing conditions, but in this case they are quite and significantly far apart.
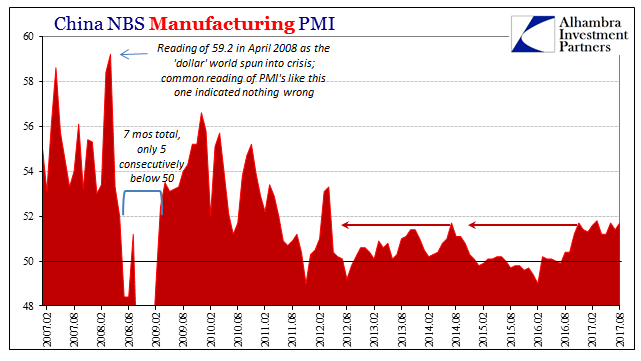
This growing distance is not a singular instance of US manufacturing confusion alone. In China, the difference was not within the one sector but between manufacturing and not. The NBS Manufacturing PMI held mostly steady in August, slightly higher than in July. At just 51.7, however, that is the same level as calculated all the way back for November 2016, suggesting, as always, not a whole lot of momentum beyond the initial upturn last year. |
China Manufacturing PMI, Feb 2007 - Aug 2017(see more posts on China Manufacturing PMI, ) |
| It’s also far too consistent with 2014 and not nearly enough of 2011 or what Chinese authorities badly wish to see again: precrisis growth tendencies.
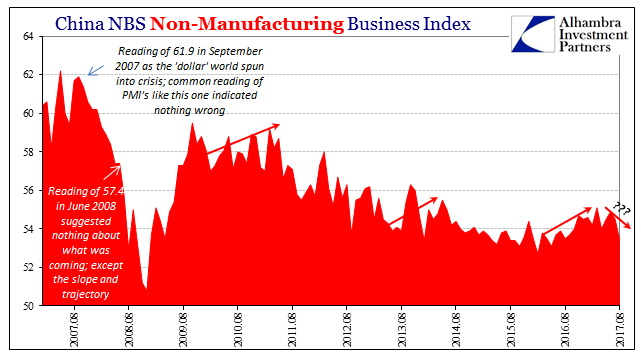
That’s supposed to be OK, though, because, we are told, China’s economy is rebalancing away from export/manufacturing and toward a sustainable internal economy. There isn’t as yet any evidence of it in data from retail sales to fixed asset investment, and now the NBS Non-manufacturing PMI has suggested intensifying weakness outside industry. |
China Non-Manufacturing Business Index, Aug 2007 - 2017 |
| The PMI reading for August was down rather sharply to 53.4. That was the lowest since May 2016, and not really that much more than the worst last year. It may be a product of monthly statistical variation, but like the manufacturing edition there was some level of acceleration indicated and only until November.
The question the PMI’s aren’t able to sort out in August is what the global economy might have been doing since then. Is it like the ISM or NBS Manufacturing, stable or slightly accelerating? Or is it like the NBS Non-manufacturing and Markit US, suggesting a turn back toward weakness again?
|
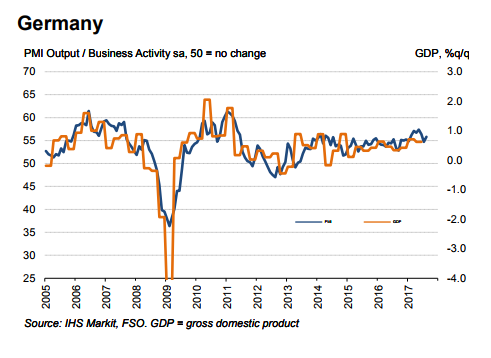
Germany PMI & Business Activity, 2005 - 2017 |
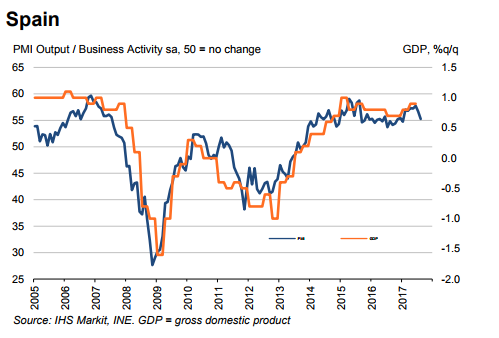
| The same problem has come up in Europe. Here, though, it is more narrative versus indices than discord among the many individual calculations. The economy in Europe is talked about as if recovery, real recovery, is not just a foregone conclusion but actually happening. In truth, not even the PMI’s suggest anything different than the past five years (give or take depending on the individual country). |
Spain PMI & Business Activity, 2005 - 2017 |
| Of the more recent data, there are divergences by geography. In terms of Composite PMI’s (those that add together manufacturing and service sector data), Germany and Ireland were the only two to measure index acceleration last month. At the same time, Spain and France both indicated 7-month lows.It’s not that Spain or France’s PMI is much different than Germany’s on that account, but more so that even sentiment data isn’t really as happy awesome as it is often described. |
US ISM Manufacturing PMI, Jan 2007 - 2017(see more posts on U.S. ISM Manufacturing PMI, ) |
It’s a problem because sentiment has been for the second time in three years far in advance of so-called hard data. That is, I believe, what is meaningful and potentially important about the flood of PMI’s all over the world. If there isn’t much if any emotional consensus on the direction of each of the global economy’s geographic parts, then there isn’t much with which to expect meaningful improvement overall.
If that latter circumstance had come about this year, there would be far more harmony in data, hard or soft, as well as narrative. A real recovery or upturn doesn’t come in flashes or the occasional and contradicted hint; when it happens there are no questions.
Tags: China Manufacturing PMI,china nbs manufacturing pmi,china nbs non-manufacturing pmi,currencies,economy,Federal Reserve/Monetary Policy,ism manufacturing index,Markets,newslettersent,PMI,U.S. ISM Manufacturing PMI,U.S. Manufacturing PMI


