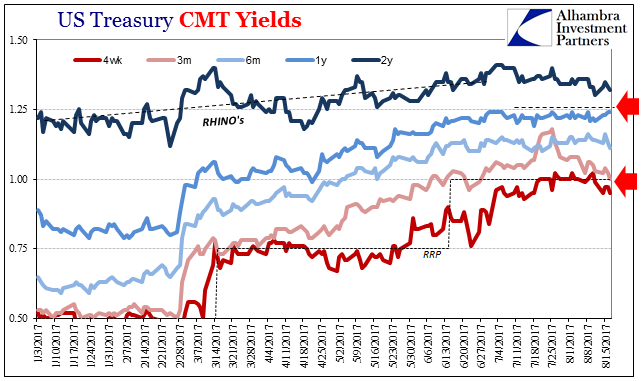
| The Fed voted for the first federal funds increase in almost a decade on December 15, 2015. It was the official end of ZIRP, and though taking so many additional years to happen, to many it marked the start of recovery. The yield on the 2-year Treasury Note was 98 bps that day.
A lot has happened between now and then, including three additional “rate hikes” dating back to December 2016, the last in June 2017. The yield on the 2-year Note is today 132 bps. There hasn’t been nearly as much hiking in those rates, less than half of what the Fed has tried to input (conundrum). |
U.S. Treasury CMT Yields, Jan 2017-Aug 2017(see more posts on U.S. Treasuries, ) |
| It hasn’t been strictly T-bills that are notable this year, though it is most noticeable in them. Misbehaving interest rates are a reflection of monetary conditions in the real economy, not as they may be perceived by academic theory about central bank rates that don’t really apply (the IOER, remember, was introduced as a floor; the RRP has failed every real world test for years). The FOMC wants to tighten monetary conditions, but this is not the tightening they would like to see (yes, there is a difference).
The equivalent yield on the 4-week bill was today again 95 bps for the second time in the last four sessions. More than that, the equivalent yield for the 3-month benchmark bill was just 1%, exactly equal to the rate offered on the RRP for the first time since late June. Debt ceiling concerns remain but have either been forgotten or overwhelmed. |
U.S. Treasury CMT Yields, Jan 2017-Aug 2017(see more posts on U.S. Treasuries, ) |
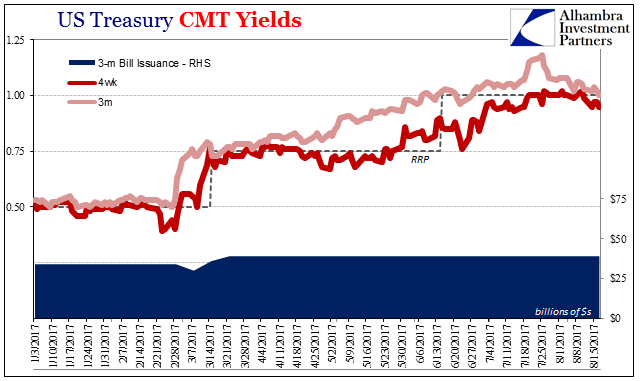
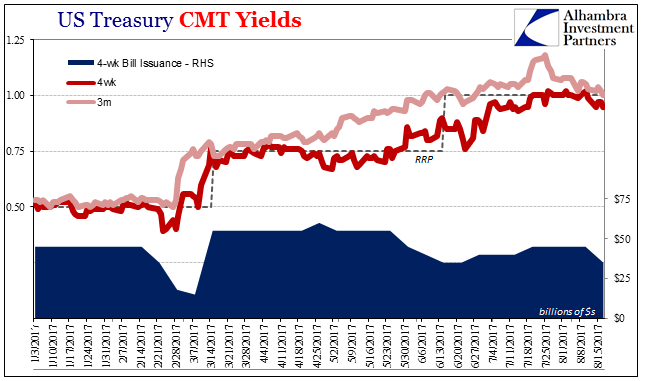
| Issuance of 3-month bills has not changed despite those future problems looming that much closer by the week. The volumes in the more variable 4-week maturity have been reduced since mid-May, raising the issue of supply imbalance. |
U.S. Treasury CMT Yields, Jan 2017-Aug 2017(see more posts on U.S. Treasuries, ) |
| But as that occurred and more so when it occurred, bill rates were at the time heading back to where they were “supposed” to be. In other words, the supply side wasn’t an issue at the time it would have been had it explained this phenomenon.
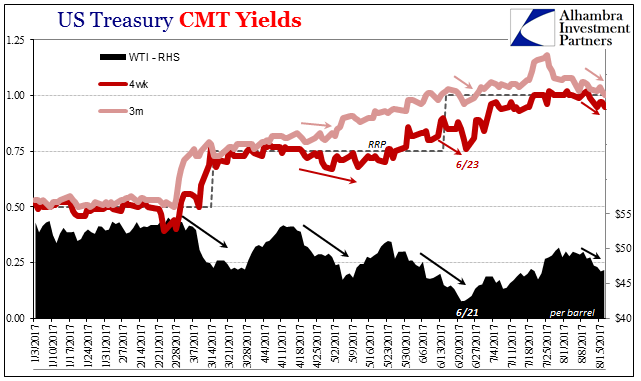
Instead, the relationship between bills and oil prices are much clearer and more pronounced. The 4-week instrument broke below the “floor” on August 11, the day after WTI fell back below $49 again. It is below $48 the last two days coincident to these conspicuously higher T-bill prices. |
U.S. Treasury CMT Yields, Jan 2017-Aug 2017(see more posts on U.S. Treasuries, ) |
| The Fed wants to tighten by rates, but gets little (really none) of it. The system instead appears to be tightening by repo, which is an entirely different matter. Just as it was in June 2014. |
Primary Dealers Net UST Positions, Jan 2007- Jun 2017(see more posts on Primary dealers, ) |
Tags: collateral,currencies,economy,Federal Reserve/Monetary Policy,ioer,Markets,Monetary Policy,newslettersent,Primary dealers,reverse repo,rhino,treasury bills,U.S. Treasuries


