Andy Hall has been called the God of Oil. As chief of Astenbeck Capital, he has proven at times that even gods can be mortal. In the “rising dollar” period, for example, after making money on the way down Mr. Hall went bullish. That was March 2015:
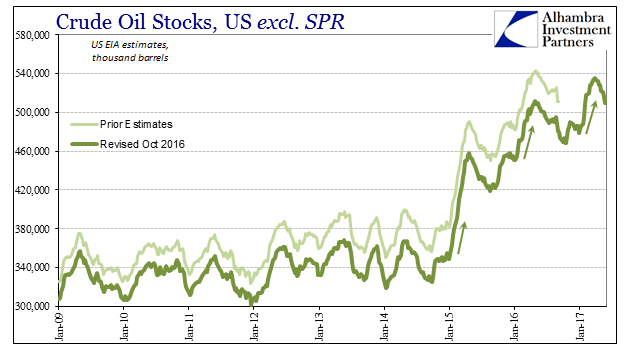
In the more than two years since then, Hall has remained steadfast about $100 oil – even as it went to $26. At that time in early 2015, under much the same calm as now, it appeared to be a possibility, perhaps likely. The “rising dollar” was really two events separated by several months (and Chinese currency machinations). What was the calm in between them, which allowed for WTI to climb all the way back above $60 from a then low of around $43, did for a time look like “transitory” weakness. But is has been these intermittent sessions of improvement that prove to be temporary, not the weakness. In terms of global crude oil, there are consequences for that. It is all piled up right now in Cushing, OK, to the tune of half a billion barrels. That’s about 41% more oil than at this time in 2013. Oil went to $26 rather than back to $100 because it wasn’t really a supply glut after all. |
Crude Oil Stocks, January 2009 - June 2017 |
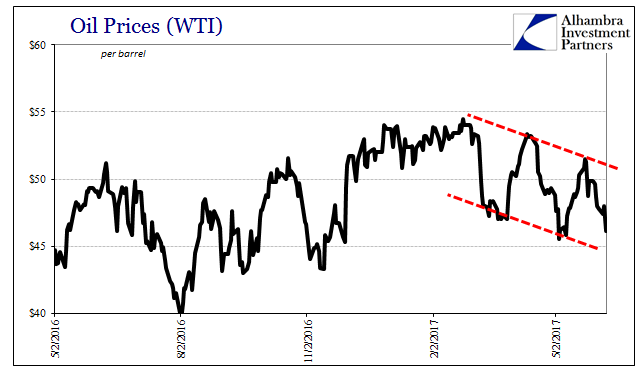
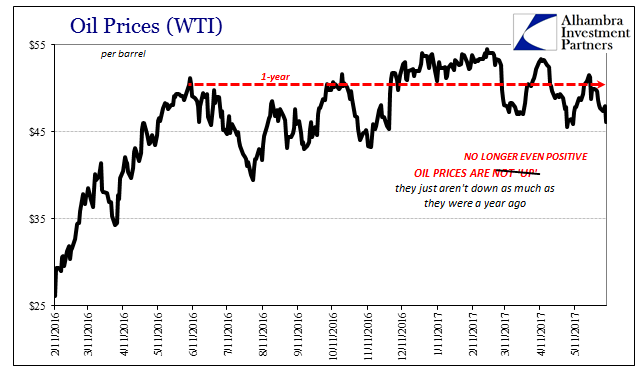
| It has made the oil market a central economic focus because it is the very place the “dollar” meets physical economics. In 2017, that means inventory. You can be enthused by oil’s rise from the depths of February 2016, but in truth WTI has traded sideways to lower for over a year now. During that time, oil inventories had risen rather than abated. With supply lower, what is left to argue? Today is another particularly bad day for oil bulls, meaning economic bulls, as the latest inventory figures from the US EIA throw more questions on what had seemed a positive result. The problem with the oil price is those secondary speculators I wrote about a month ago:
|
Oil Prices, May 2016 - June 2017(see more posts on oil prices, ) |
| For these people, inventory is their biggest enemy since it is their direct competition. If it looks like it might disappear quicker, then you might hold on longer anticipating if not $100 then maybe $75 or at least $65. If, on the other hand, it looks like it might take longer to be reduced because of stubbornly tepid demand, you might be more inclined t sell if not forced to liquidate on days like today that have become more common.
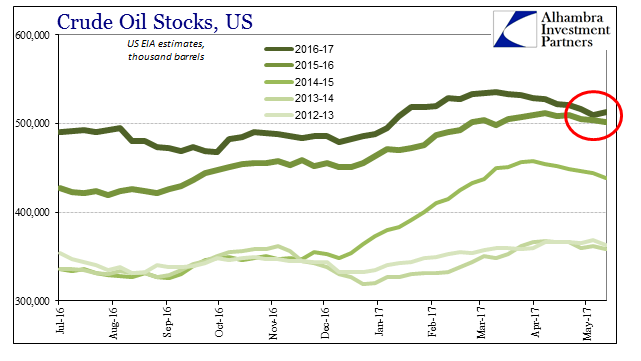
US inventories of crude had been draining at an unusually good rate, turning lower a bit sooner than the usual seasonal drawdown. As of last week, inventory levels were nearly equal to the same week in 2016. |
U.S. Crude Oil Stocks, July 2016 - June 2017 |
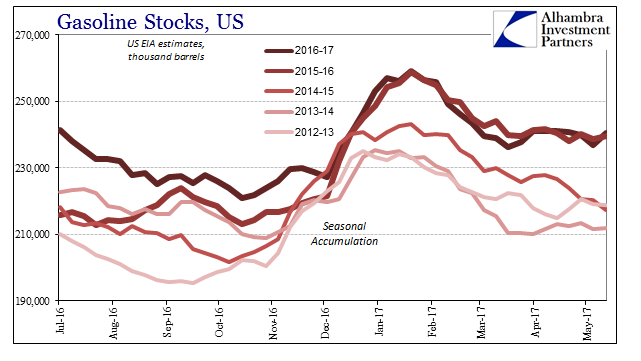
| Today’s report of a large build, including gasoline, is therefore an unwelcome development possibly interrupting what was threatening to maybe become slightly less pessimistic. That’s actually the best that can be described of it, because getting inventories in 2017 just to be equal with those in 2016 is no serious accomplishment. It is merely Step 1 of 100, with numerous potential pratfalls embedded in the calendar as well as economy and financial conditions. |
U.S. Gasoline Stocks, July 2016 - June 2017 |
Nevertheless, many will remain undeterred because of, I write with only slight hyperbole, the unemployment rate (big thanks again to M Simmons):
That was the God of Oil on June 1 this year, pressing his case with as usual “generally encouraging global economic indicators.” There was scarcely a time over the past three years when such global economic indicators were not encouraging, or at least described altogether in the mainstream that way (“strong” consumers). What made his commentary noteworthy, however, was that in part he blames the low level of oil prices on “fake news”, somehow suggesting that the media, they of the “supply glut” uniformity, have been so overly pessimistic as to distort what are truly favorable conditions. |
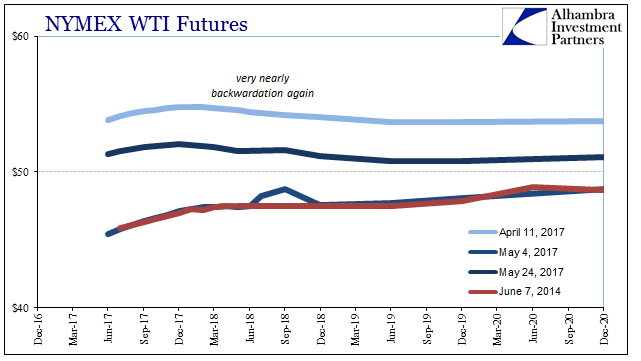
Futures Curves, December 2016 - December 2020 |
| He is right about one thing, though. It is all about inventory because though oil prices are higher than the bottom and things might look better today, that really doesn’t mean all that much in reality. The WTI futures curve has clearly noticed that (again). |
WTI Oil Prices, February 2016 - June 2017(see more posts on oil prices, ) |
Full story here Are you the author? Previous post See more for Next post
Tags: currencies,demand,depression,dollar,economy,eurodollar system,Federal Reserve/Monetary Policy,gasoline,Markets,newslettersent,oil prices,supply,WTI,wti futures


