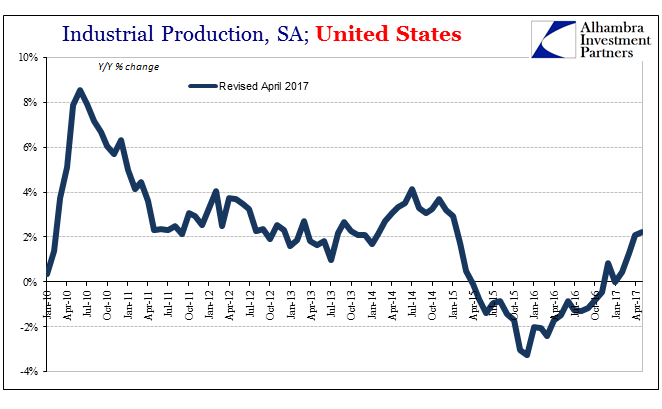
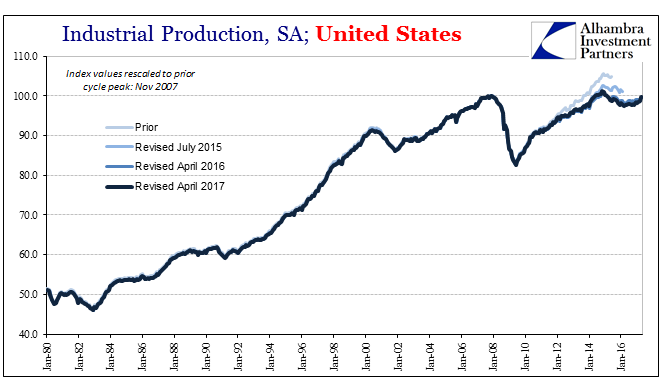
| Last month US Industrial Production rose rather quickly. Gaining more than 1.1% month-over-month, it might have appeared that the US economy once dragged into downturn by manufacturing and industry was finally about to experience its belated upturn. But is how it has always gone, not just in this latest phase but for all phases since around 2011. Each good month is followed immediately by a disappointing one. What should be uninterrupted positivity is left instead as going nowhere. |
US Industrial Production(see more posts on U.S. Industrial Production, ) |
| For May 2017, the Federal Reserve estimates that Industrial Production was fractionally lower than in April 2017; essentially flat. Year-over-year, what was 2.1% growth in the preceding month has been followed by 2.2% growth in latest one. Acceleration remains exasperatingly absent. |
US Industrial Production, January 1980 - June 2017(see more posts on U.S. Industrial Production, ) |
| The production of consumer goods, long the weakest spot in the IP universe, has only stagnated since the middle of 2015. Year-over-year, production levels are up about 1.1%, meaning that going back to early 2015 the IP index is only 1.3% higher now. This segment of the IP report is a cutting commentary on this economy as it relates to the consumer condition, both short run as well as long-term. |
Industrial Production Consumer Goods, January 2006 - June 2017 |
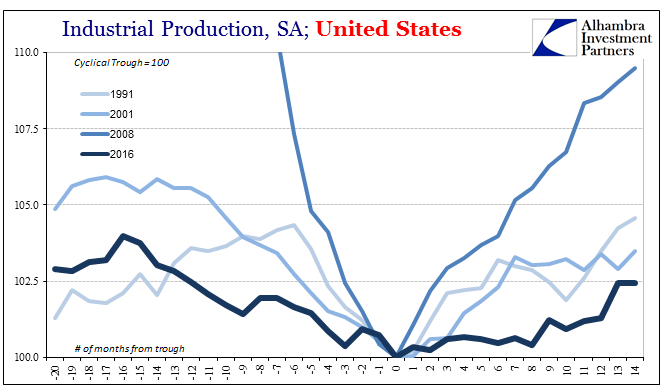
| Overall, this upturn, upswing, improvement, or however you want to characterize it (“reflation”) remains short of even the 2002 recovery from the dot-com recession. That’s the period when US manufacturing simply disappeared to overseas regions on the combination of flexible global finance (eurodollar) and ready cheaper labor. If the last fourteen months are outperformed by that specific fourteen months, then badly needed economic momentum is surely missing. |
US Industrial Production(see more posts on U.S. Industrial Production, ) |
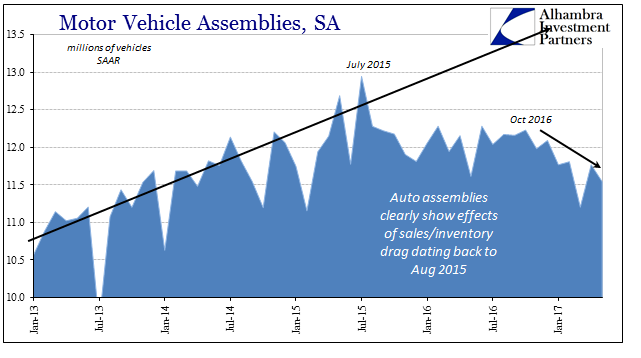
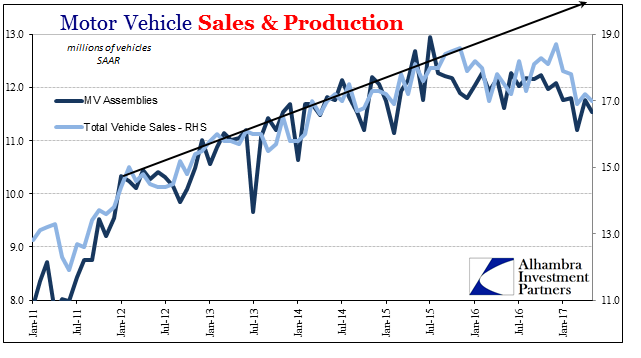
| One of the primary reasons for its absence continues to be the drastic imbalances confronted by automakers. Motor Vehicle Assemblies, the IP proxy for domestic auto production, is in a clear downtrend that began last October – not October 2015 or even October 2014. For the month of April 2017, the Fed had initially estimated a more robust rebound (11.92mm SAAR) from serious weakness in March, but in this latest update has cut that back (11.77mm SAAR) preserving the recent lower trend. |
Motor Vehicle Assemblies, January 2013 - June 2017(see more posts on Motor Vehicle Assemblies, ) |
| So far, auto production is merely following sales rather than moving ahead of them (on the downside) to truly clear out what have become for many manufacturers record inventory levels. The BEA in a separate data series figures that total vehicle sales after rising somewhat in later 2016 to perhaps encourage more steady production have in 2017 dropped off again just like early last year. Thus, Ford Motor’s intended “plateau” is so far instead a double top. |
Motor Vehicle Assemblies, January 2006 - June 2017(see more posts on Motor Vehicle Assemblies, ) |
| That in all likelihood accounts for the sudden downtrend in assemblies, as having broken the prior uptrend all the way back in the middle of 2015, now two years ago, it seems pretty clear consumers aren’t going back to that pace and acceleration no matter any subsequent economic improvement. |
Motor Vehicle Sales and Production, January 2011 - May 2017(see more posts on motor vehicle sales, ) |
As noted yesterday with regard to a relatively bland retail sales report:
|
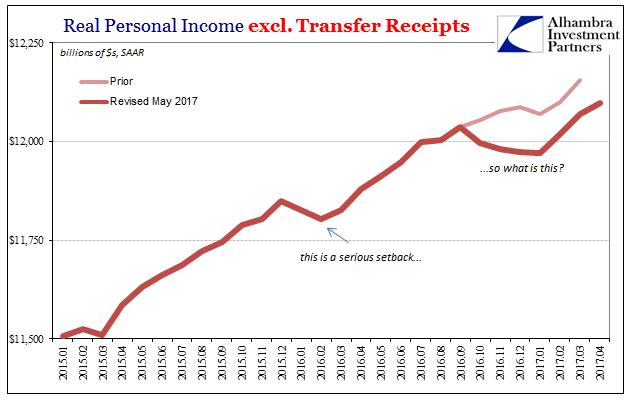
Real Personal Income Excluding Tranfer Receipts, January 2015 - June 2017(see more posts on real personal income excluding transfer receipts, ) |
We are left with a muddle, but a muddle that exists on both sides of zero. It is shallow contraction followed by shallow positives, a repeat of 2012 and after. There is no momentum because there can’t be. In non-linear terms, as I wrote last summer, there is only mischaracterization and confusion mostly because we don’t notice it like we would an official contraction:
To be perfectly honest, I am at a loss to describe it. I’ve also written for years that these are unique circumstances and they have proven to be just that (4.3% unemployment rate and almost two years of industry contraction without recovery at the same time?). Even though I believe the term “depression” is as close as one might hope to pin an accurate label, it elicits an emotional response that too often changes the focus to the initial contraction part (2008 wasn’t close to 1929, but that’s not what defines the problem) away from where it belongs in the absence of recovery. It is that last piece what is relevant today. Contractions happen; failed recoveries do not. At least they didn’t. Now they have repeated, three times so far (after 2008; after 2011; after 2016). It might be left to future historians to come up with the quasi-official term, to me it is clear and constant eurodollar erosion and “dollar” decay. It can’t end until they do |
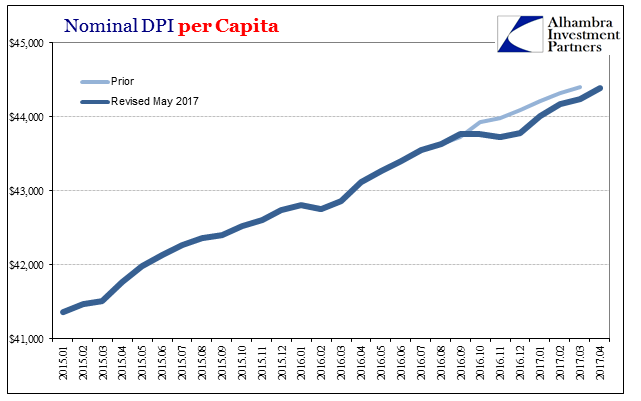
Nominal DPI per Capita, January 2015 - June 2017 |
Full story here Are you the author? Previous post See more for Next post
Tags: consumer goods,consumer spending,currencies,economy,Federal Reserve/Monetary Policy,income,industrial production,Markets,Motor Vehicle Assemblies,motor vehicle sales,newslettersent,real personal income excluding transfer receipts,total vehicle sales,U.S. Industrial Production


