| Yesterday was something of a data deluge. In the US, we had the predictable CPI dropping again, lackluster US Retail Sales, and then the FOMC’s embarrassing performance. Across the Pacific, the Chinese also reported Retail Sales as well as Industrial Production and growth of investments in Fixed Assets (FAI). When deciding which topics to cover yesterday, it was easy to leave off the Chinese portion simply because much of it didn’t change.
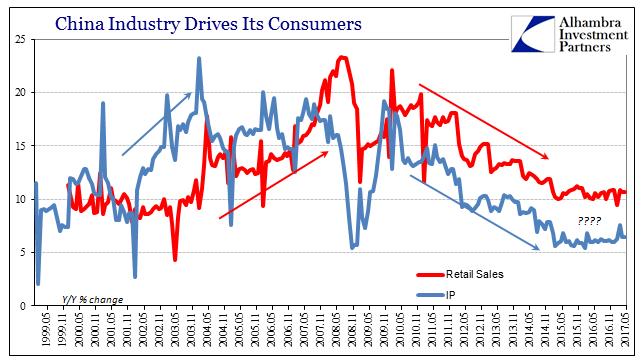
In the case of IP and Retail Sales, that was literally the case. Growth rates for both were identical in May to what was presented for April. For the former, IP remains stuck at 6.5% after just one month (7.6% March) that suggested acceleration. Chinese retail sales were again 10.7%, which again almost perfectly matches the average for the last now 34 months. |
China Industry Drives Its Consumers, May 1995 - May 2017 |
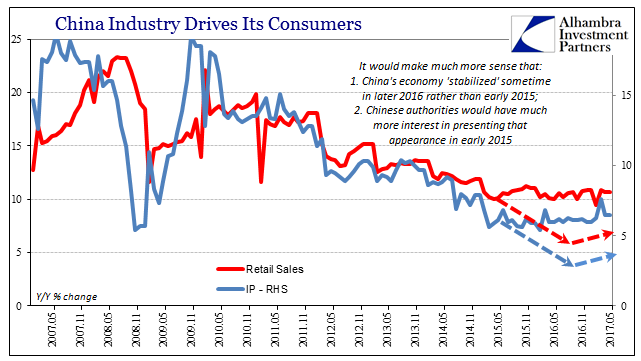
| Because of this static, sideways trend, I have been forced toward the suspicion that there may be some fudging going on here. The results for May 2017 do nothing to allay them, and in fact only further their unwelcome cause (I don’t relish indulging in conspiracy). But, as you see clearly above and immediately below, it’s difficult not to suspect something is going on and has been the past more than two years now. |
China Industry Drives Its Consumers, May 2005 - May 2017 |
|
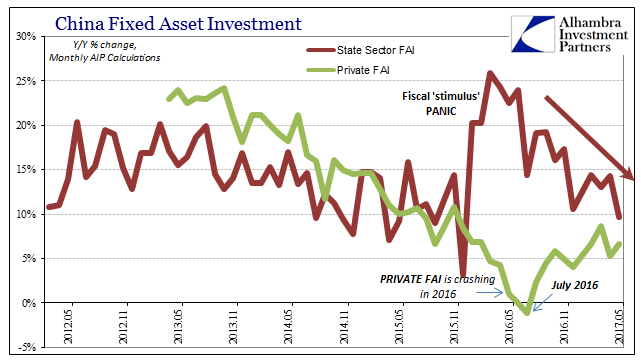
I think it perfectly reasonable, sadly, that Retail Sales as well as Industrial Production might have been less than was reported, perhaps substantially less. It was during this crucial period that China’s financial markets (“dollar” connections and all) were under extreme duress, not the least of which was due to increasingly grave economic concerns. Presenting a more stable economy, even if at a lower relative rate, would have been highly preferable to trends all pointing further downward. That these statistics continue moving sideways will suggest, under this theory, that IP and Retail Sales might still be a year later less than the published estimates. I detest thinking this way, but it’s becoming difficult not to at least consider the possibility though it will likely never be confirmed (at least not until long after it would be useful). China’s Big 3 statistics also contain Fixed Asset Investment, arguably, for the Chinese people anyway, the most important of the three. Over the past year and nearly a half, FAI has been carried by the government sector through its various SOE’s (state-owned enterprises). As Private FAI decelerated alarmingly, even contracting at one point in the middle of last year, China’s authorities may have felt they had little other choice. As the private side rebounded in later 2016, the level of SOE involvement and growth lessened. Without confirmation as to intent, it was reasonable to assume that was due to nothing more than official expectations for Private SOE to continue recovering; this “stimulus” was surely only meant as a temporary measure as it always is in these circumstances.
|
China Fixed Asset Investment, May 2012 - May 2017(see more posts on China Fixed Asset Investment, ) |
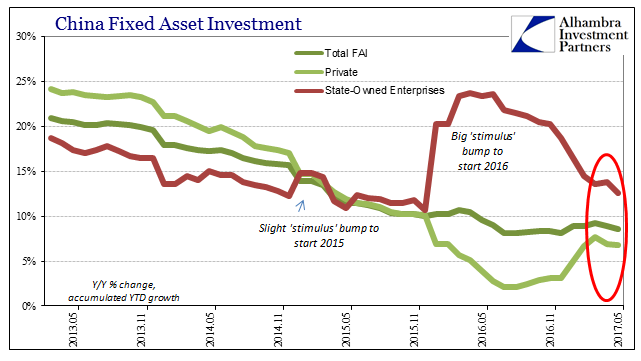
| For April 2017, the accumulated growth rate of the state-owned sector in FAI had pulled back to less than 14%, and just a little more than that year-over-year for the single month alone. That was down from rates in excess of 20% the year before, suggesting that more incremental deceleration was preplanned.
Like so many other things around the global economy this year, Private FAI did not continue in an upward direction, increasingly and stubbornly disappointing. The accumulated growth rate started out the year (for the January-February 2017 period combined) at 6.7%, and there it has largely stalled. China’s National Bureau of Statistics reports that for May 2017, the accumulated growth rate is just 6.8%. Reengineering that into a monthly rate for just May, year-over-year growth was but 6.6%. The reported growth rate suggest that FAI on an accumulated basis, meaning for the five months of 2017 combined, rose by just 12.6% for SOE’s. For the single month of May, the growth rate appears to be less than 10% for the first time since 2015. |
China Fixed Asset Investment, May 2013 - May 2017(see more posts on China Fixed Asset Investment, ) |
|
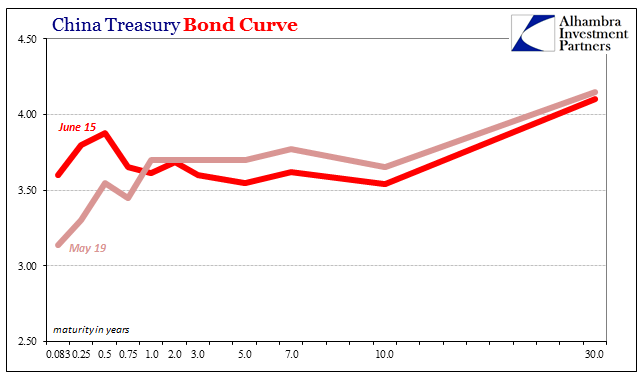
That would be pre-stimulus levels for China, not in keeping with the disappointment of Private FAI. With capex in the private economy slowing or at least not accelerating, you would think Chinese officials would try to offset that more with renewed vigor on their side. To see instead the rate further decline in May is jarring. There are other factors to consider, too. Chinese monetary conditions have only worsened, which the mainstream attributes to direct and intentional PBOC policy. It is, as usual, a mistaken impression as Chinese markets are being restricted by their “dollar” basis. Further, it was in late May that Moody’s downgraded Chinese government debt, provoking what appeared to be a determined CNY appreciation (the PBOC suddenly using a “countercyclical” fudge factor in determining the daily float band for only its dollar exchange value). It raises further questions about official “stimulus” in the SOE channel of FAI. There are monetary as well as credit reasons for believing China’s government is being restricted by these factors in a way it probably does not want to be. Taken altogether among the three data points, we therefore have to consider the negative possibilities vis-à-vis what we already see of eroding “reflation.” If China was a big contributor to it, and there is little doubt it was, then this all might suggest one angle as to why that enthusiasm over the past month or so has nearly disappeared. |
China Treasury Bond Curve(see more posts on china treasury bond, ) |
Tags: China,China Fixed Asset Investment,china treasury bond,currencies,dollar,economy,exports,fai,Federal Reserve/Monetary Policy,fixed asset investment,Global Economy,global trade,industrial production,Markets,newslettersent,Retail sales,statistics


