| Having finally established that the economy of the “rising dollar” was appreciably worse than first estimated, we can turn our attention back toward figuring out what that means for the near future and beyond. According to the latest estimates for Industrial Production, growth has returned but in the same weird asymmetric sort of way that is actually common for the past decade. Year-over-year IP expanded by 1.5% in March 2017, the highest growth rate since February 2015 more than two years ago.
Though that sounds impressive, it says more about the decline than the rebound. As the Federal Reserve currently has it, the trough of what was surely a near-recession for US industry was March 2016.
|
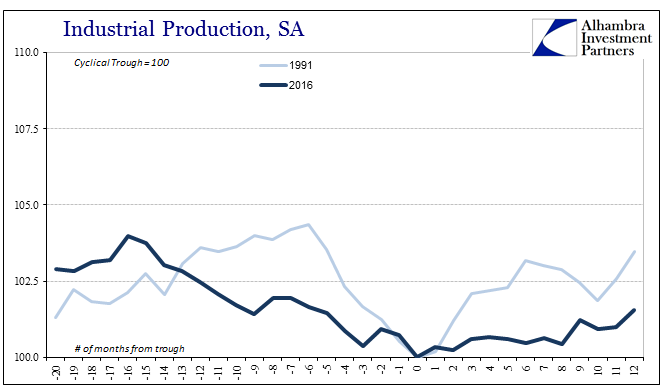
Industrial Production, 1991 - 2016(see more posts on industrial production, ) |
| Extended declines like those in 2015 and 2016 have never before occurred outside of recession. That doesn’t immediately propose one for that period, but it does highlight just much trouble the US economy had encountered by that point; it was a very serious matter, not the least of which due to the monetary component driving it.
That means exactly one year has passed since the low point of a significant downturn. A growth rate of 1.5% is therefore measly in comparison to past downturns where IP contracted for more than a month or two.
|
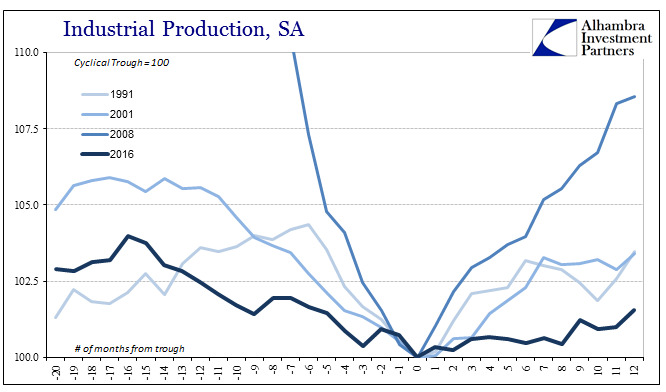
Industrial Production, 1991-2016(see more posts on industrial production, ) |
| After the dot-com recession, for example, one year after the trough in November 2001 industrial production had expanded by 3.4%, more than double the rate of the current “rebound.” After the 1990-91 recession, twelve months after the bottom IP had grown by 3.5%.
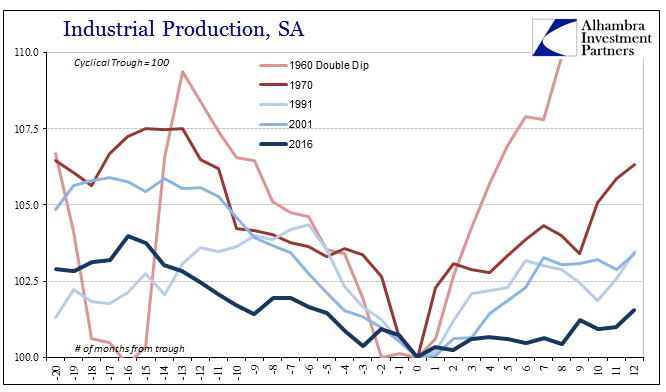
And so it is for all comparisons where the current track is substantially below them all, including those of similar proportions (on the downside). It is far closer to an “L” shape than the normal “V.” This is far from surprising, of course, as it suggests (very strongly) nothing has changed in the economy except an end to the latest lengthy contraction phase. |
Industrial Production, 1960-2016(see more posts on industrial production, ) |
| This meandering of positive numbers is a regular feature of the post-Great “Recession” economy where symmetry is broken each and every time there is a slowdown or downturn of any scale and duration.
Whether viewed from capacity utilization or the production of consumer goods, the 2016-17 improvement visibly lacks any enthusiasm and vigor. |
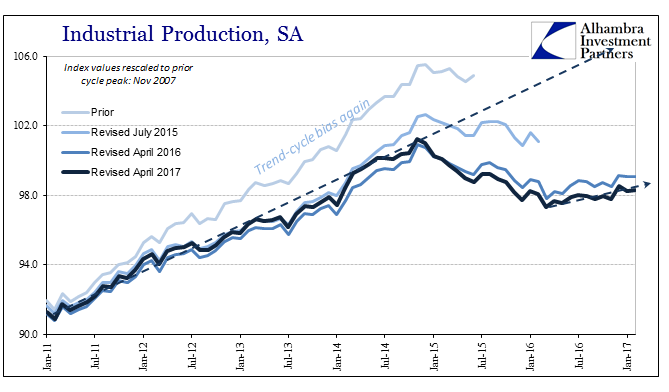
Industrial Production, July 2015 - April 2017(see more posts on industrial production, ) |
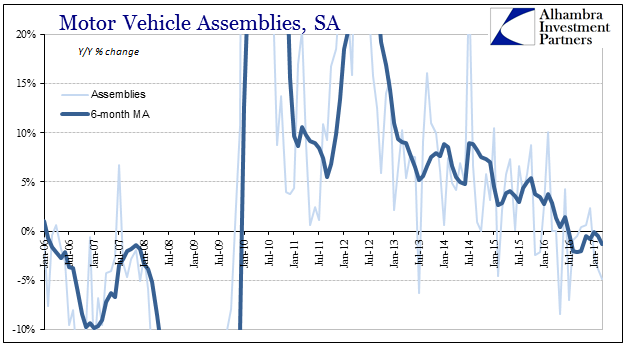
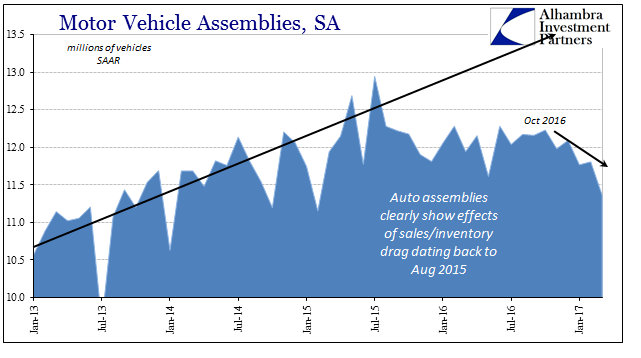
| One primary reason for this subdued positivity is the auto sector. Motor vehicles have turned from the only bright spot during the economy of the past seven years to now its primary drag. The Federal Reserve as part of its statistics on Industrial Production estimates that domestic motor vehicle assemblies, their proxy for auto production inside the US, fell to a seasonally-adjusted annual rate (SAAR) of 11.36 million in March 2017. |
Capacity Utilization, January 2011 - January 2017(see more posts on capacity utilization, ) |
| Dating back to October, automakers here have been forced to act on the combined forces of 2015-16 inventory buildups as well as the lack of sales growth during that time. The Fed’s estimate of vehicle production has matched pretty closely the BEA’s estimate of total vehicle sales, including a similar plunge in sales in March. At just 16.9 million (SAAR), total vehicle sales were, like motor vehicle assemblies, the fewest since February 2015. |
Motor Vehicle Assemblies, January 2006 - January 2017(see more posts on Motor Vehicle Assemblies, ) |
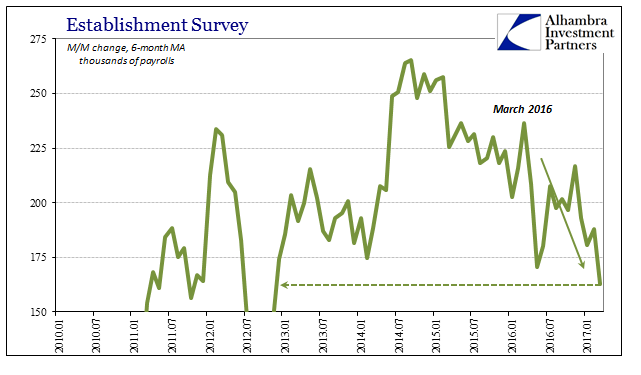
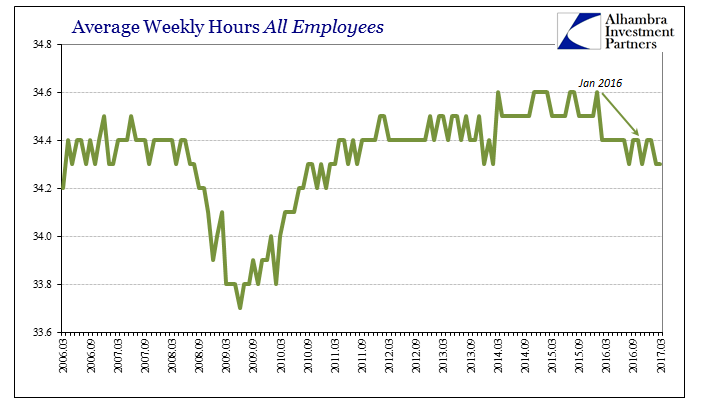
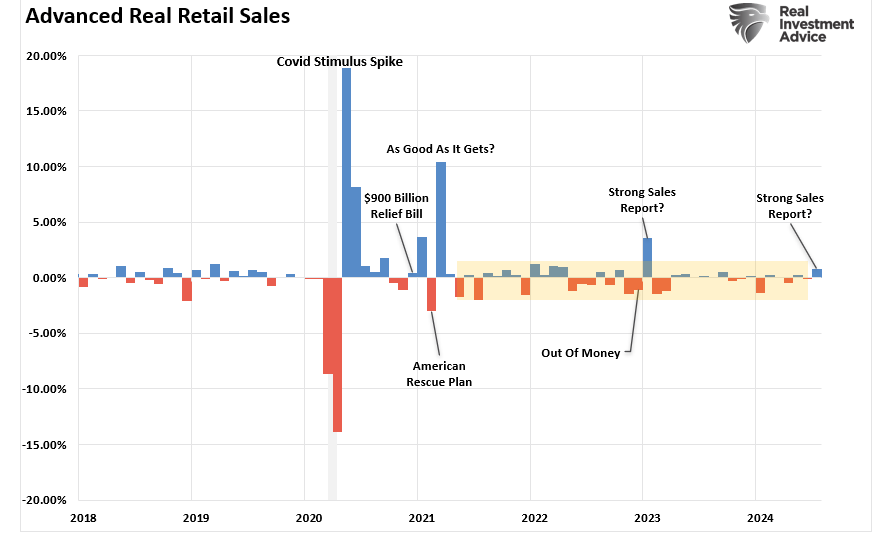
| All of which points us in only one further direction: US consumers. Given that the weakness even on this plus side of the 2016 downturn is still pronounced in broad fashion, such as retail sales, it corroborates both those other statistics as well as the ongoing slowdown in the labor market (according to most BLS numbers apart from the unemployment rate). This is highly unusual for any number of reasons, but since this economy departed from the historical template a very long time ago we shouldn’t be surprised there is no rulebook or manual from which we could set our expectations. |
Motor Vehicle Assemblies, January 2013 - January 2017(see more posts on Motor Vehicle Assemblies, ) |
| In more typical cycles, all weakness is condensed and consolidated such that it appears to happen almost all at once; and then reverse in the same fashion (symmetry). Even when there are lags between first or second order effects and those of the third and even fourth orders, they are generally small in recessions. Over the past six years going back to 2011, the pathology of each downturn is different. The only commonality seems to be the proximate cause for them (all of them), the “dollar.” | 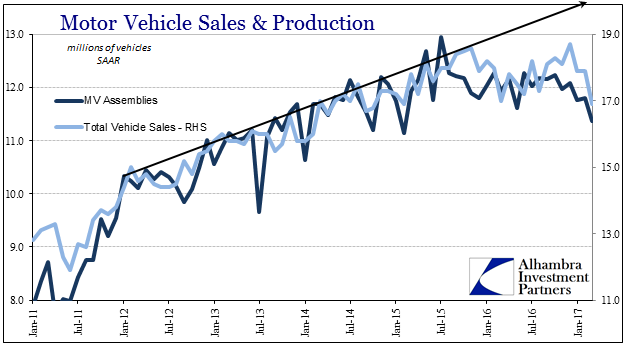 |
| In the “rising dollar” episode, it meant first manufacturing weakness to the point of extended but shallow contraction, and only beyond the lowest point in manufacturing did the labor market finally start to display these more serious negative tendencies. It suggests that the labor market propagated broad economic weakness in a long, low amplitude-like wave almost completely detached from the “manufacturing recession” (second order effects almost completely separated from third order effects?). Again, manufacturing had already turned to positive numbers by the time the labor market really registers the full effect of the “rising dollar” disturbance. |
Establishment Survey, January 2010 - January 2017(see more posts on establishment survey, ) |
| I don’t know if that means the channel by which weakness is being transmitted via US consumers is strictly sentiment (obviously in direct contradiction to surveys of sentiment, consumer and otherwise) or other perhaps financial adjustments. As I wrote above, this economic case is entirely new. What we can reasonably claim as a baseline, however, despite the uniqueness of the situation is that weakness is, like the “dollar” background, a constant feature. And there is still nothing to suggest why that would have ceased, or might cease in the near future, to be the base direction. |
Average Weekly Hours, March 2006 - March 2017(see more posts on average weekly hours, ) |
Tags: autos,average weekly hours,Business Cycle,capacity utilization,currencies,depression,downturn,economy,establishment survey,Federal Reserve/Monetary Policy,industrial production,manufacturing,Markets,Motor Vehicle Assemblies,motor vehicle sales,newslettersent,total vehicle sales


