


Joseph Y. Calhoun
My articles My siteAbout meMy videosMy books
Follow on:LinkedINTwitterSeeking AlphaAmazon
Economic Reports Scorecard
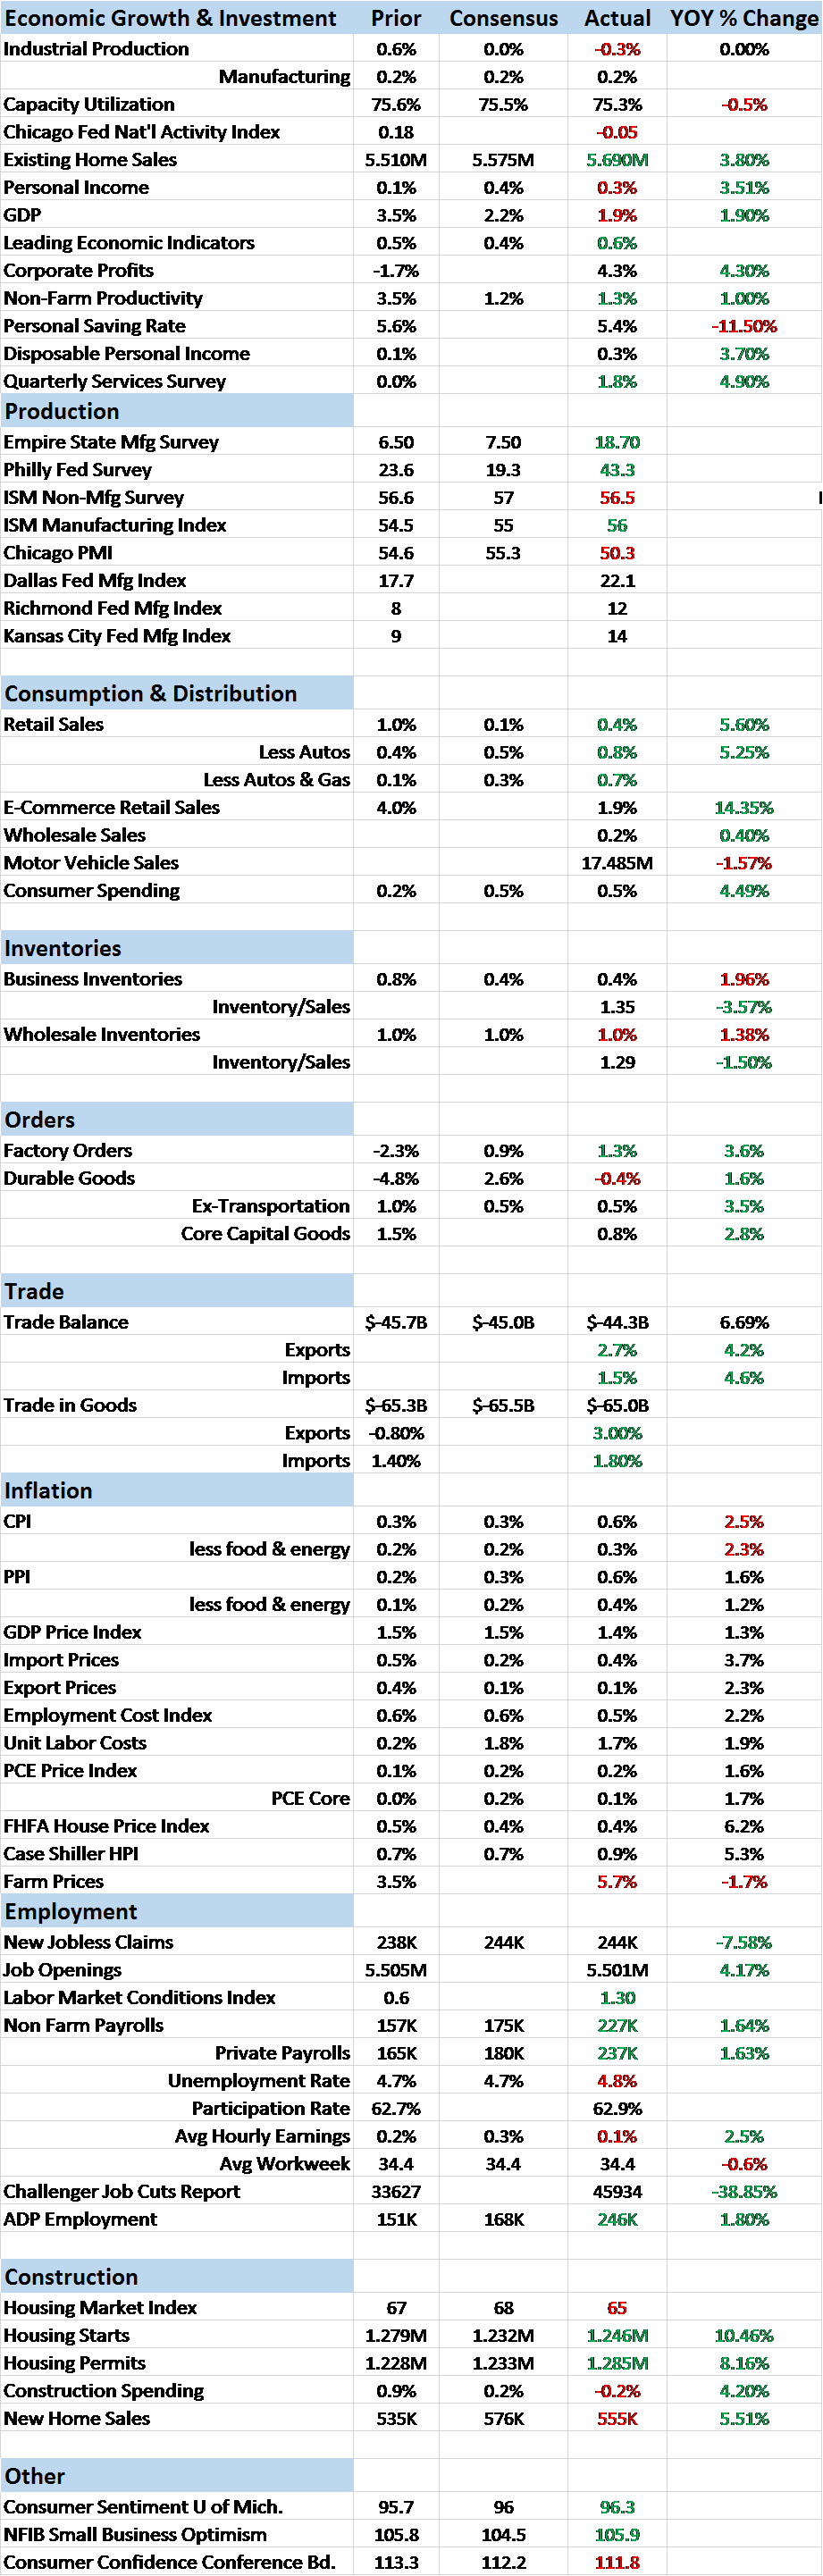
The economic data released since my last update has been fairly positive but future growth and inflation expectations, as measured by our market indicators, have waned considerably. There is now a distinct divergence between the current data, stocks and bonds. Bond yields, both real and nominal, have fallen recently even as stocks continue their relentless march higher. The incoming, current data seems to support the notion of better growth but falling rates – real rates are negative out to at least 5 years now – point to, at best, a continuation of the weak, 2%ish growth we’ve been getting for the last several years. The Chicago National Activity Index, released last Thursday, confirms that diagnosis, coming in at -0.05. a reading guaranteed to frustrate bulls and bears alike.
As noted in my last report, consumption has accelerated recently, a reflection of the better consumer sentiment surveys we’ve seen since the election. To be something more than a few months blip though it will need to be supported by better production and higher incomes. Unfortunately, industrial production continues to disappoint, down again last month. The regional Fed surveys and various PM indexes are pointing to improvement but those are basically sentiment surveys as well. All this really proves is that the people who answer the regional Fed surveys and PM surveys are no different than the average consumer surveyed by the U. Of Michigan. And they are feeling better about things even though they have no tangible reason – yet – to feel so. We may be about to find out exactly how far “animal spirits” can carry an economy.
Let’s not mitigate the positives though. A big part – the major part – of the slowdown over the last two years has been energy related. With oil prices stabilized – for now – in the mid $50s, drilling activity has been accelerating over the last year. That’s an obvious short term positive; the fear of mass defaults in the oil patch that prevailed last January has passed. Given OPEC’s history of compliance with quotas and with inventories at post WWII highs, the risks would seem to be to the downside but for now the improvement in the energy industry is a positive for the economy. And overall, business inventory/sales ratios appear to have peaked for now and are coming down smartly. That’s a positive for future GDP, assuming the recent sales pace can be maintained.
Employment also appears to be solid with weekly jobless claims continuing to track at very low levels. We believe there are reasons that metric doesn’t provide as clear a picture as it once did but there is no denying that the job market is viewed by the market as on solid footing. The same could be said for automobile sales and real estate both of which continue to track near cycle highs. The problem though is that these metrics are no longer improving. New home sales, for instance, at a 555K annual rate in January are essentially no different than they were in February 2015 at a 549K annual rate. Motor Vehicle sales show a similar pattern, no improvement for the last two years.
The bullish argument is that those flat sales coincide with the energy bust and now that we’re punching holes in the ground again, all is well. I suppose that is true for now but it doesn’t sound like anything to cheer if you ask me. Is our future economic growth dependent on the price of oil? Countries that depend on commodity prices for their prosperity are not generally ones we think of as leading economic powers. Indeed there is a concept in economics known as the resource curse which observes that countries blessed with abundant natural resources also happen to be have lower economic growth and less democracy than those who are not so blessed. We aren’t Brazil yet but our growing dependence on energy as a source of economic growth is disconcerting to say the least.
| The incoming data in any case is about the past. One may glean a trend or two from newly released information but we have to look to markets for real clues about the future. And that’s where we run into a bit of problem lately as markets’ opinion about the future diverge. Bond, commodity and currency markets have lately been reversing their post-election moves while stocks continue merrily along, new high after new high.
The 10 year Treasury yield has fallen 16 basis points over the last two weeks even with firm economic data. Nominal growth expectations have fallen: |
10 Year US Treasury Yield Index(see more posts on U.S. Treasury, )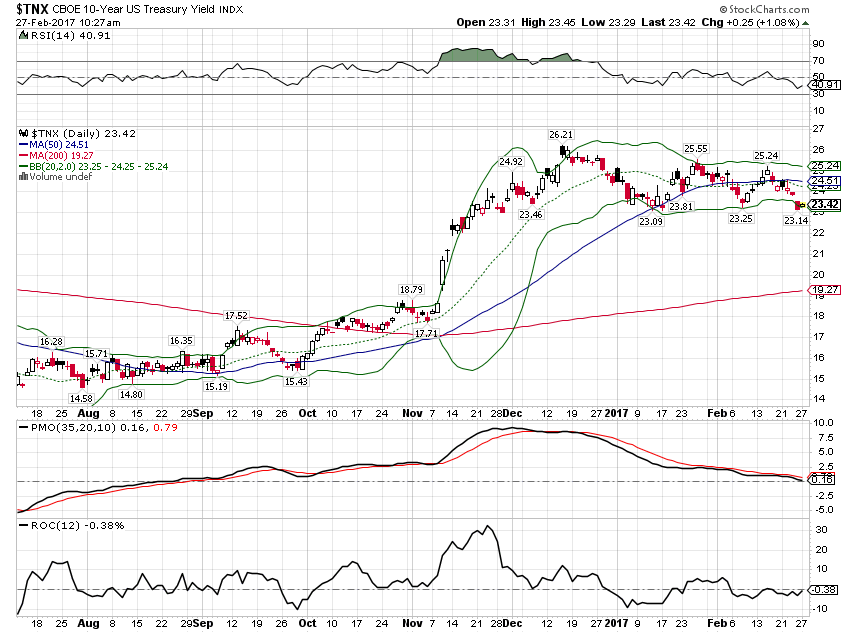 - Click to enlarge |
10 Year TIPS yields fell 10 basis points:These are of course small moves and may not be anything other than so much noise. Still they are interesting as they are counter to the story being told by the stock market. My best guess is that the pull back in yields is an acknowledgement by the bond market that tax reform and other economic policy changes are not going to be easy or quick. |
10-Year Treasury Inflation-Indexed Security 2012-2017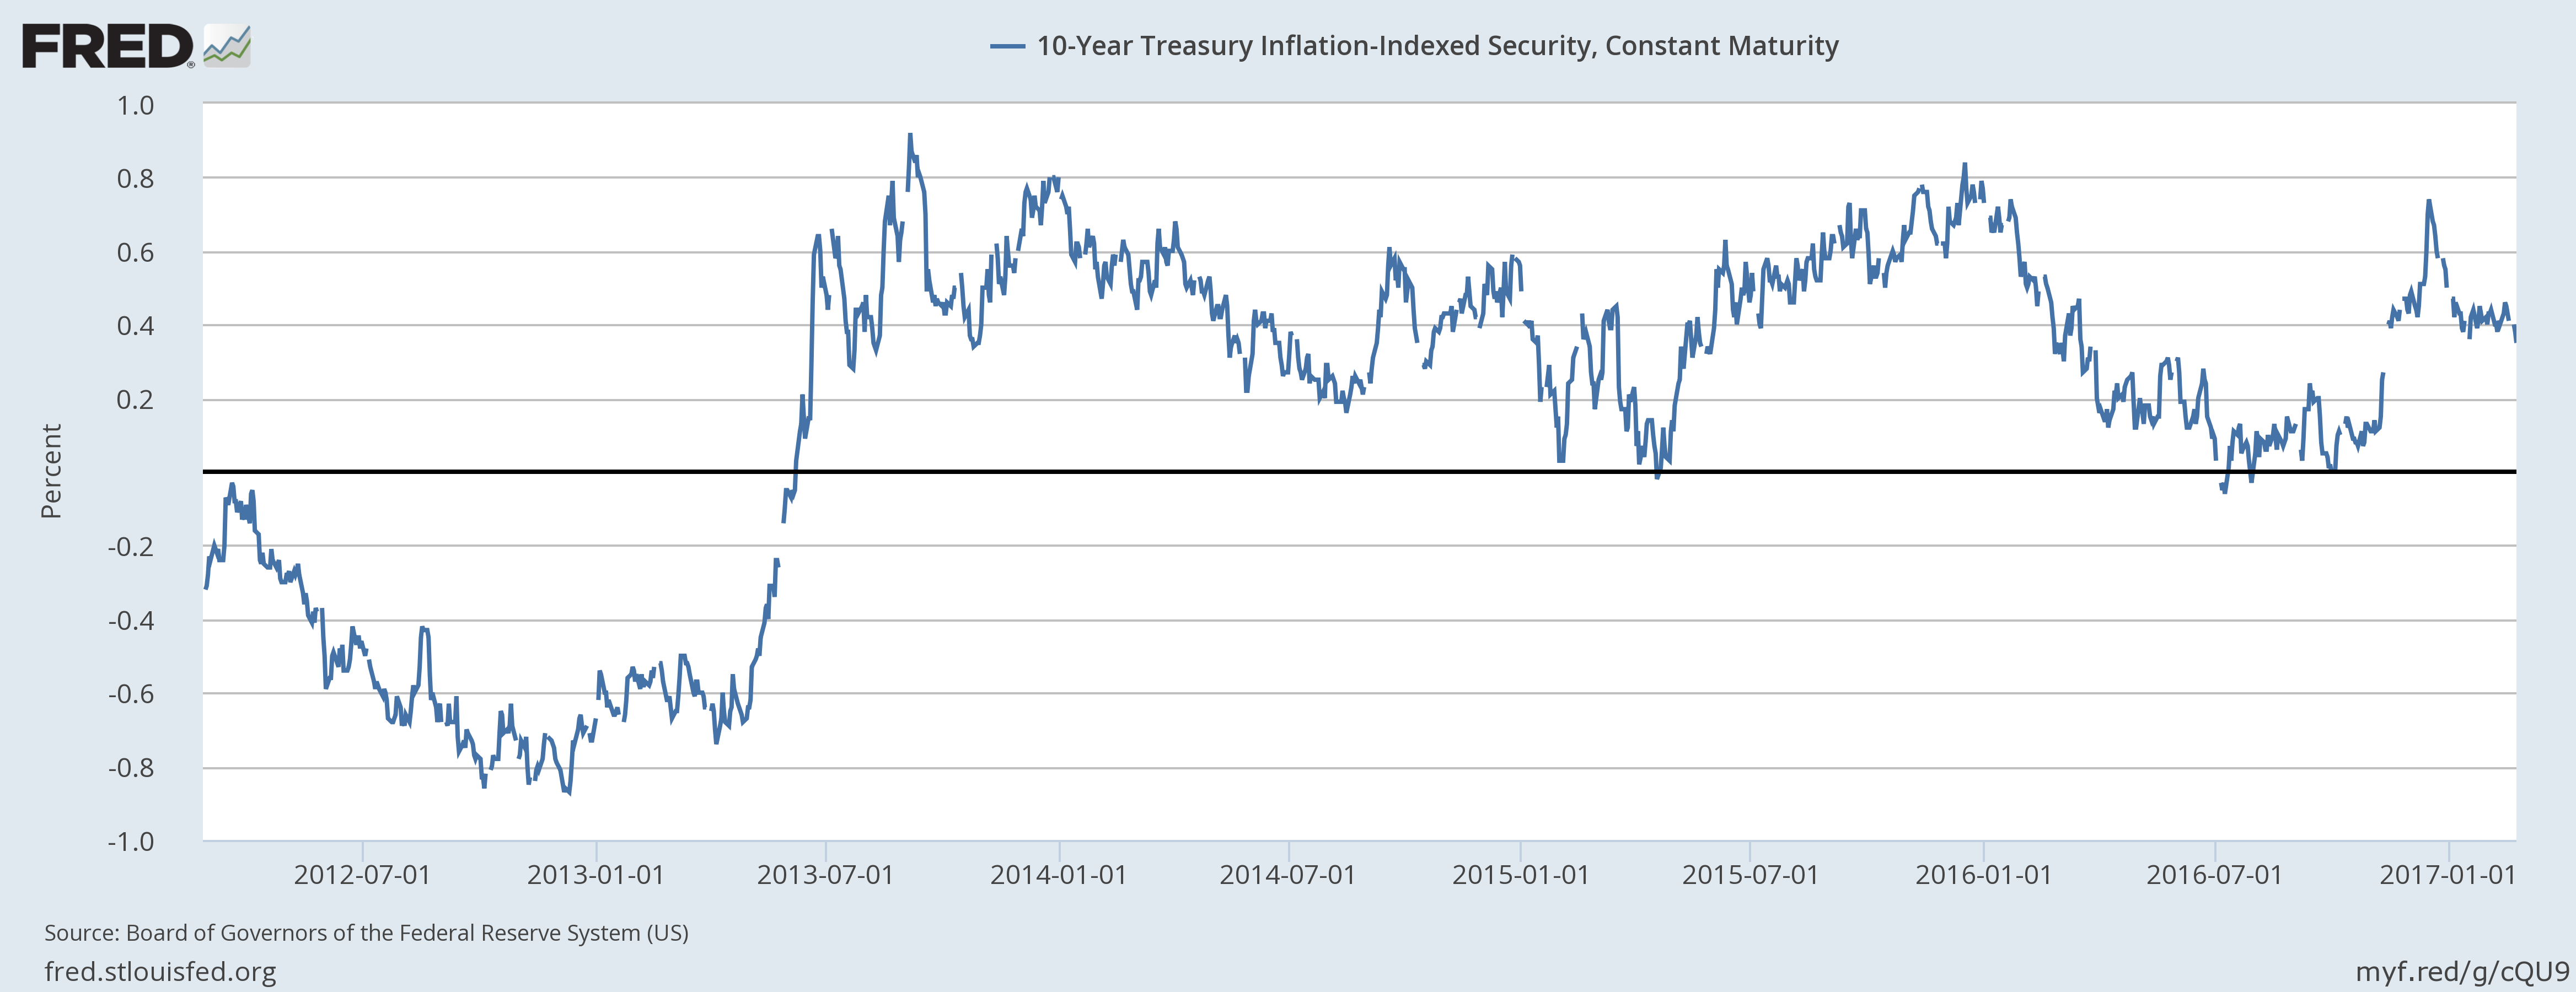 - Click to enlarge |
| The yield curve flattened ever so slightly over the last two weeks (4 basis points). The spread between the 10 year and 2 year yield is still in the middle of its historic range although the next move would seem logically to be toward narrowing. But there is nothing in the yield curve that says recession anytime soon. |
10-Year Treasury Constant Maturity Minus 2-Year Treasury Constant Maturity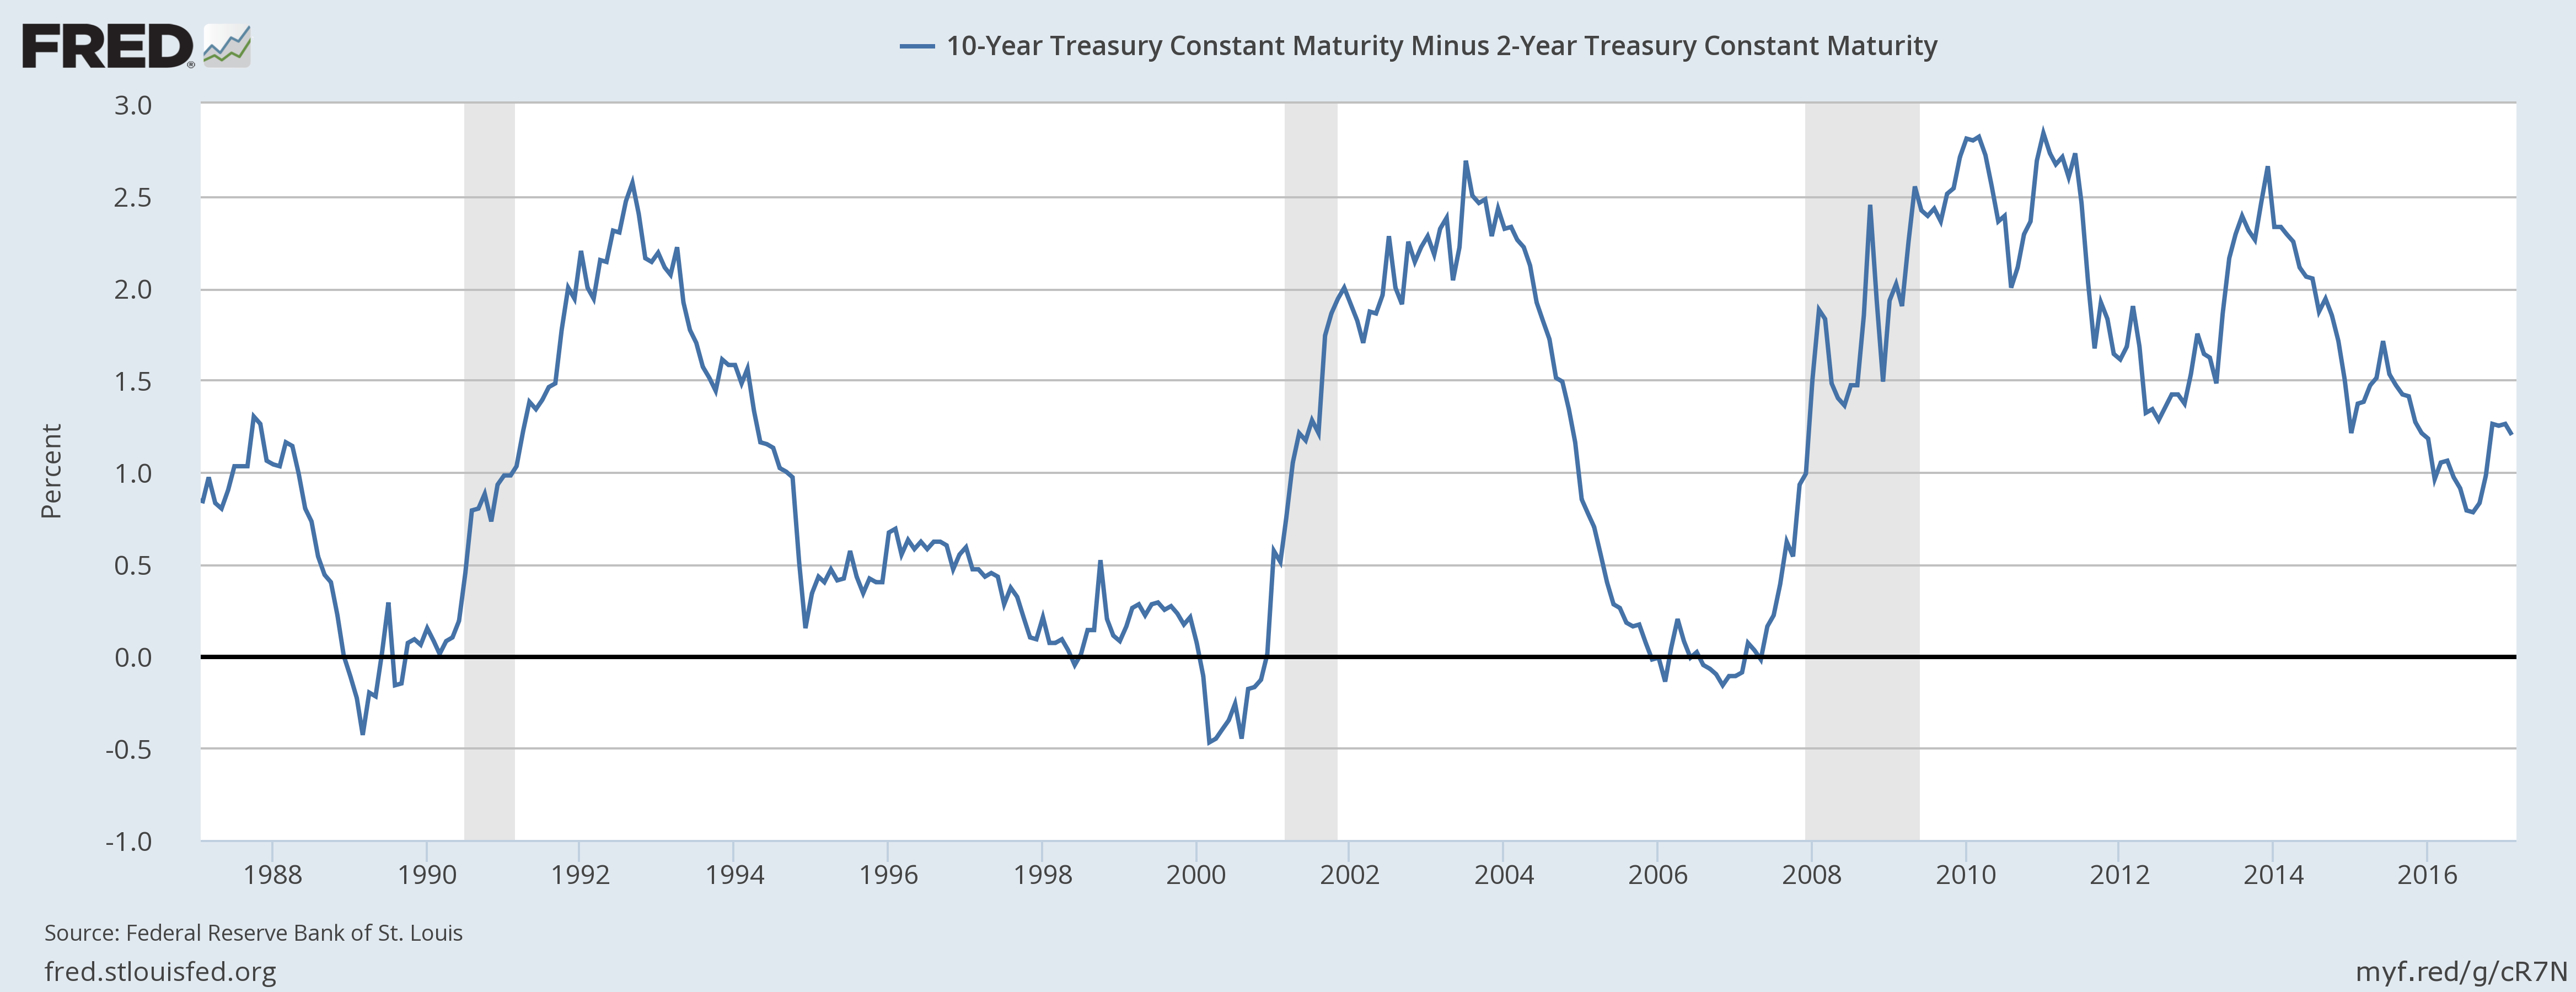 - Click to enlarge |
| Credit spreads didn’t move much since the last update but the trend is obvious. Like the yield curve, there is nothing in credit spreads that warns of recession. We are still about 40 basis points from the narrowest spread of this cycle and even further from the best levels of the last cycle. |
BofA Merrill Lynch US High Yield Option-Adjusted Spread 2010-2017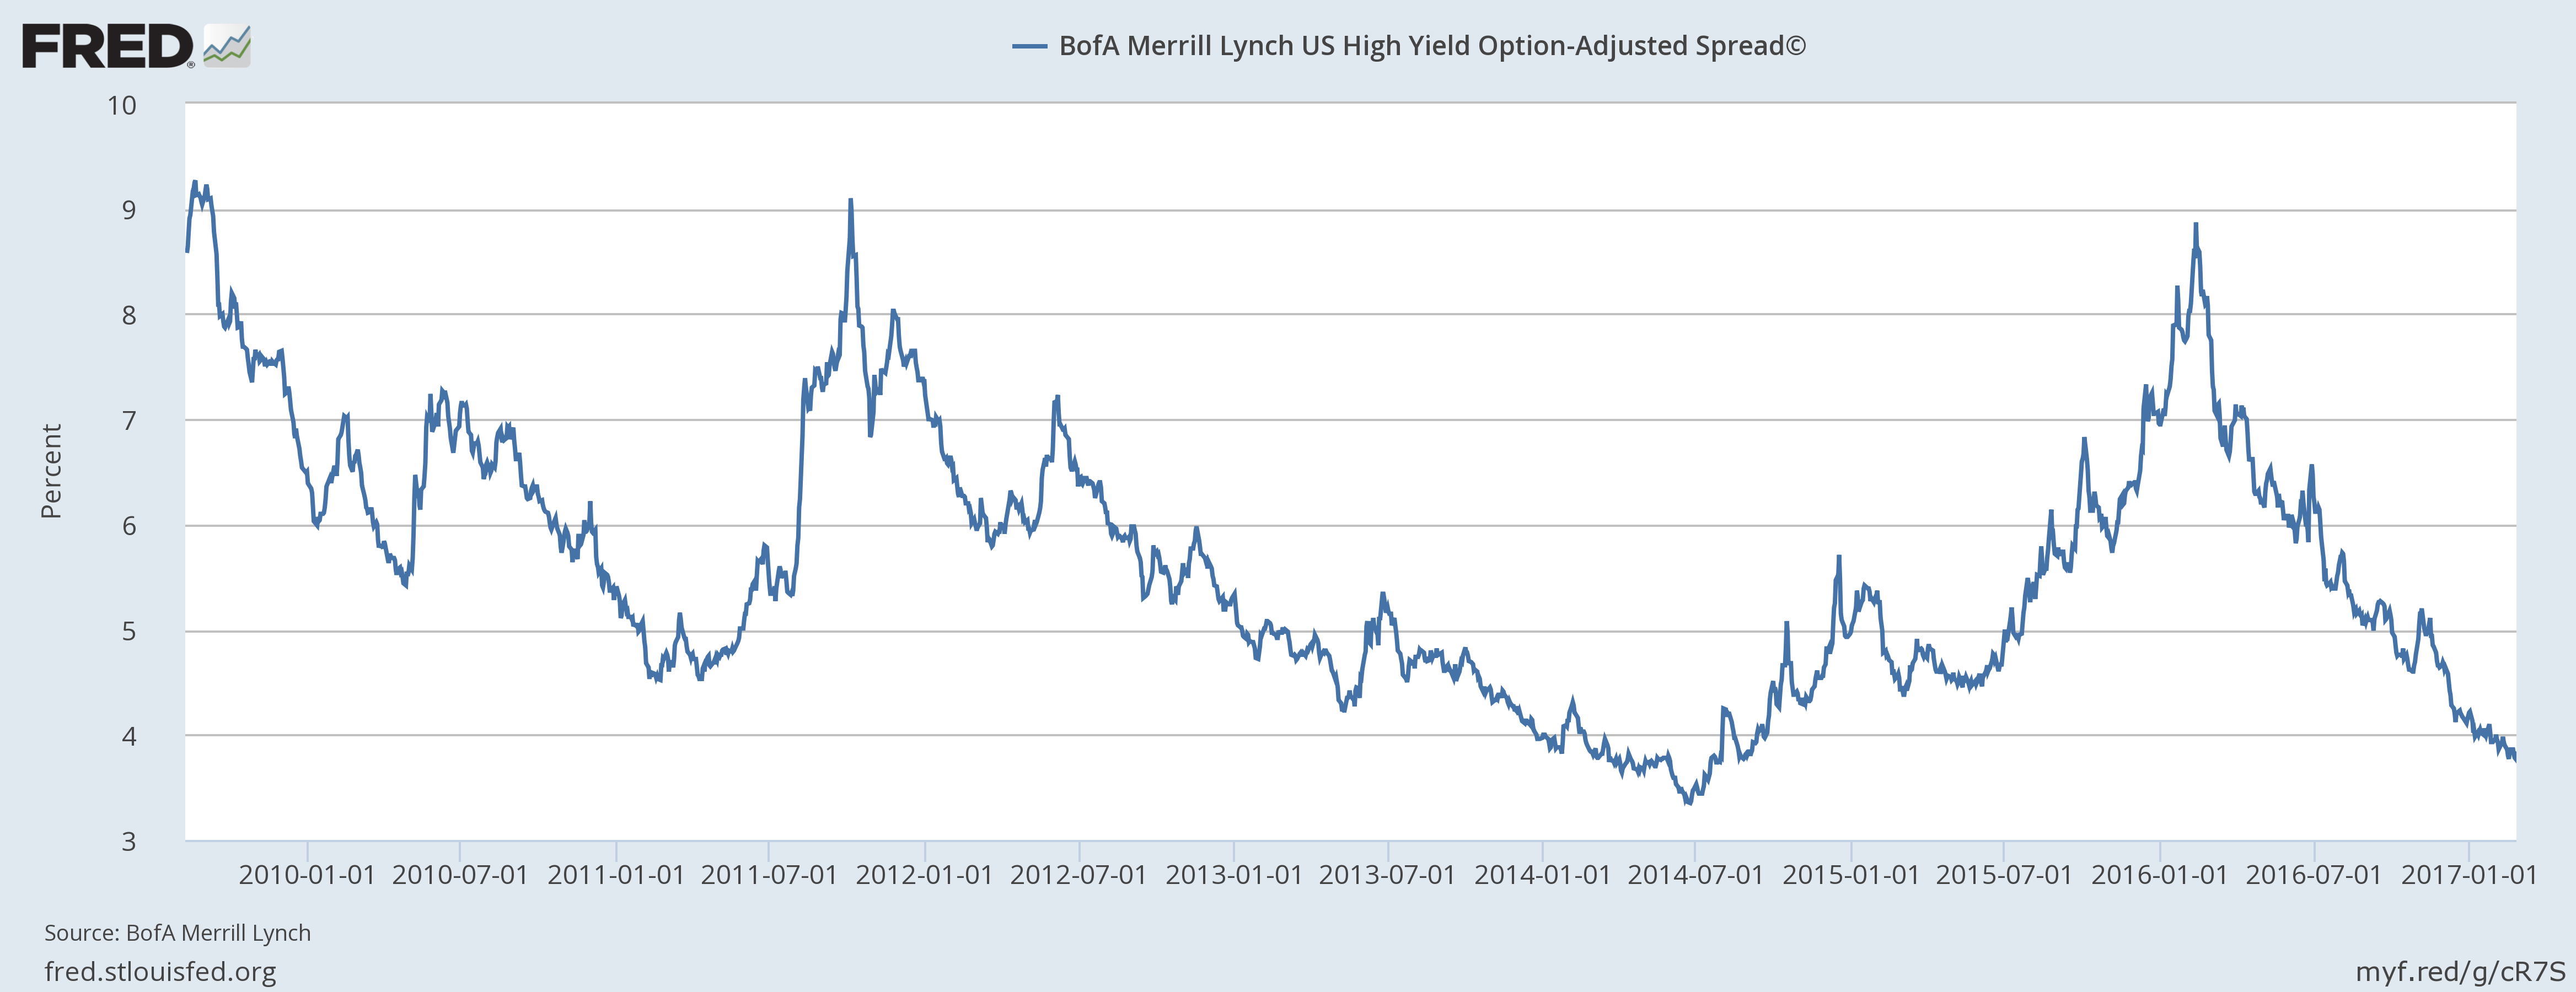 - Click to enlarge |
| The dollar index is basically unchanged since mid-month but it does seem to be encountering resistance to more upside. Not surprising really since it seems that everyone is already bullish. If I had nothing to go on but sentiment I’d be a seller, in size, of dollars today. |
U.S. Dollar Index(see more posts on U.S. Dollar Index, )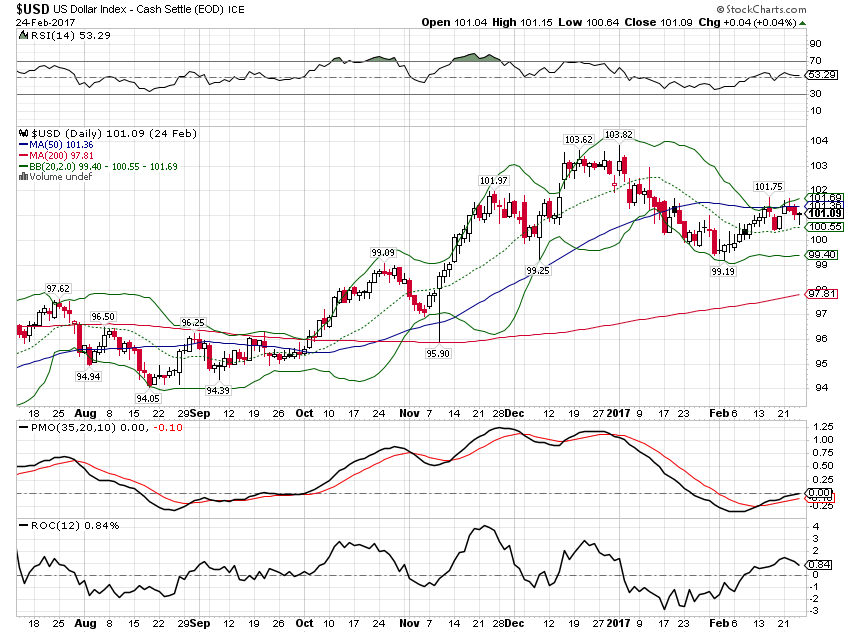 - Click to enlarge |
| Gold rose though pointing to perhaps further weakening of the dollar index: |
Gold - Continues Contact(see more posts on Gold, )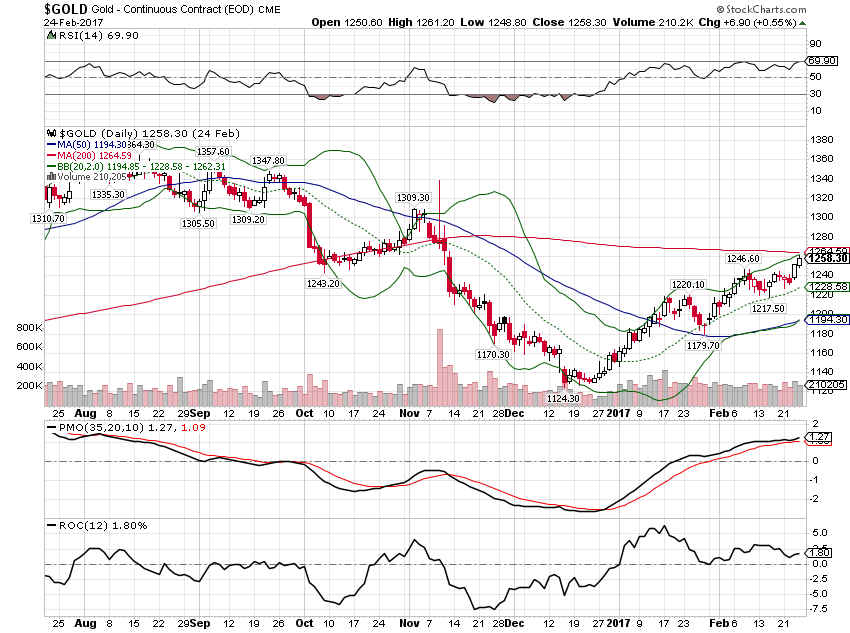 - Click to enlarge |
| The one market that shows no flagging enthusiastic expectations of growth is the one for equities. Stocks have continued to move up to new highs. Nothing has dented the enthusiasm of the buyers. |
S&P 500 Large Cap Index(see more posts on S&P 500 Large Cap Index, )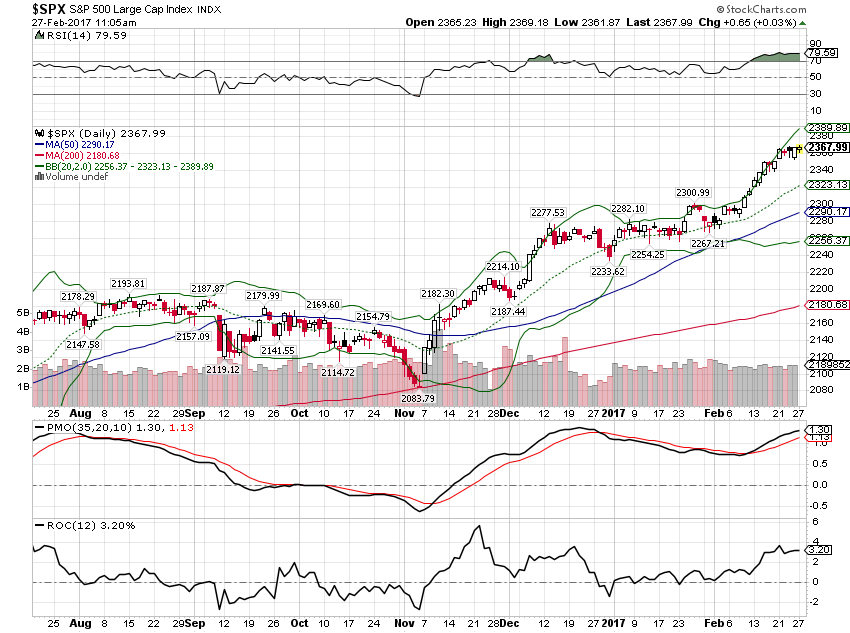 - Click to enlarge |
| It is possible that the contradiction between stock and bond markets isn’t as great as it seems. Theoretically at least, there is the possibility that the Trump policy changes will be positive for corporations and their bottom lines but not for the economy as a whole. A cut in corporate taxes will certainly be positive for the companies and shareholders who receive it. The impact on the economy as a whole is harder to figure but would also seem positive. Maybe the moves in bonds are nothing more than those market’s attempt to adjust more precisely to the coming changes. If that is true get ready for more volatility since at this point we don’t know what the changes will be or when they might be enacted. Tax reform may not be all it is cracked up to be and in any case looks like a 2018 event at best.
For now, I continue to believe based on the sum of all the indicators we follow that the most likely outcome is more of the same. The economy is growing around a 2% pivot and that seems unlikely to change anytime soon. The most important economic indicator is found in real interest rates. The graphical representation of “secular stagnation” is the 5 year TIPS chart. This is stagnation: |
5-Year Treasury Inflation-Indexes Security 2004-2017 - Click to enlarge |
I don’t know whether a move in real rates is the catalyst for better growth or the result but until we get out of the range that has persisted since right after the last crisis, I would not expect to see a significant change in economic growth. Trump can talk all he wants about 3% or 4% growth but as long as real rates are negative, it is just that – talk.
Tags: Alhambra Research,Bi-Weekly Economic Review,Bonds,cfnai,Consumer Sentiment,credit spreads,currencies,economic growth,Gold,Market Sentiment,Markets,newslettersent,oil prices,real interest rates,S&P 500 Large Cap Index,U.S. Dollar Index,U.S. Treasury,US dollar,Yield Curve


