Jeffrey P. Snider
My articles My offerMy siteAbout meMy videosMy books
Follow on:LinkedINTwitterSeeking Alpha
| The National Bureau of Statistics (NBS) of China does not publish any of the big three data series (Industrial Production, Retail Sales, Fixed Asset Investment) for the month of January. It combines January data with February data because of the large distortions caused by Lunar New Year holidays. Unlike Western holidays that are but a single day, the Golden Week is a week, and therefore when the calendar points do not align from one year to the next it creates often very large base effects that make interpretations difficult if not inappropriate.
This prohibition does not extend to other Chinese data, including estimates for external trade. As such, it was reported that China’s exports grew by 7.9% in January year-over-year, the first positive number since March 2016. Given that the (revised) 11.2% growth last March was itself a product of base effects and holiday-related distortion, there isn’t a comparison to be made that might be the least bit meaningful. After all, that one increase followed a 25% contraction the month before (only partially related to the Golden Week effects, as it turned out) and another nine straight declines thereafter. We can’t even be sure when these deformations take place or may fully play out. Some years there are great discrepancies January and February, while others February and March. In 2014, for example, exports rose 10.5% that January but fell 18.1% the next month. In 2015, China’s exports jumped 48.3%, with not just China holiday comparisons to figure but also the resolution of the port strike by West Coast dockworkers. The following month, March 2015, exports fell 15%. The import side is, obviously, also vulnerable to data incompatibility. In January 2013, for instance, imports surged by 29%, well above the pace throughout 2012 and what would prevail in 2013. Imports in February 2013 dropped by nearly 15%. This was the reverse of the holiday pattern in 2012, where imports fell sharply, by 15%, in January 2012 only to spike by 40% that February. Taking both months together, however, the growth rates are more in line with economic conditions at those times; January and February 2012 combined were 8.2% above 2011, and relatively close to the 5.3% average for imports that year; January and February 2013 inbound trade into China was up a combined 5.1%, also close to the 7.6% average during 2013. With the Lunar New Year 11 days earlier this year than last year, it is in all likelihood that comparisons of January to January and February to February will have to be netted out. Until that takes place, it seems a reasonable approach would be that of the NBS for IP, retail sales, and FAI. |
China Exports and Imports, January 2011 - January 2017(see more posts on China Exports, China Imports, )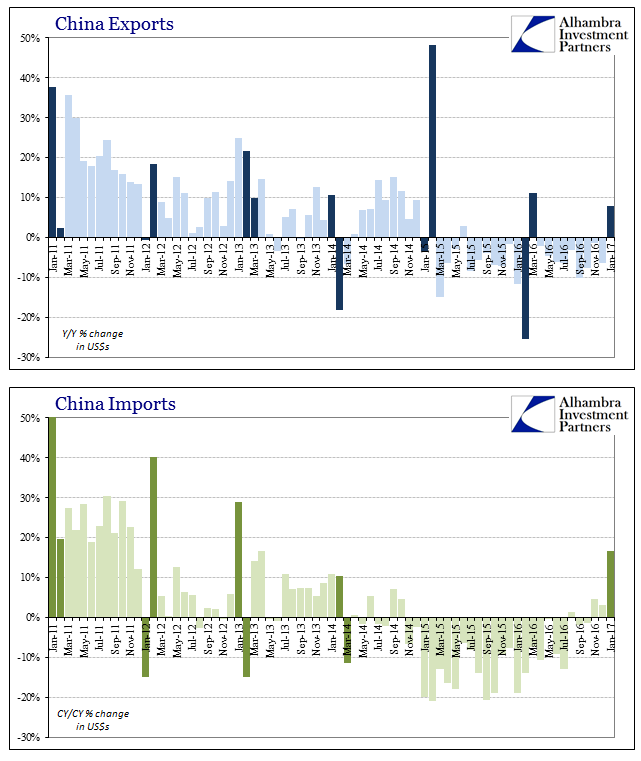 - Click to enlarge |
Tags: base effects,China Exports,China Imports,currencies,economy,Federal Reserve/Monetary Policy,global trade,imports,Markets,newslettersent,statistics