Charles Hugh Smith
My articles My offerMy siteAbout meMy videosMy books
Follow on:TwitterFacebookYoutubeAmazon
If we had to guess which areas will likely experience the smallest declines in prices and recover the soonest, which markets would you bet on?
Though housing statistics such as average sales price are typically lumped into one national number, this is extremely misleading: there are two completely different housing markets in the U.S. One is hot, one is not so hot.
Just as importantly, one may stay relatively hot while the other may stagnate or decline.
All real estate is local, of course; there are thousands of housing markets if we consider neighborhoods, hundreds if we look at counties, cities and towns and dozens if we look at multi-city metro regions.
But consider what happens to average sales prices when million-dollar home sales are lumped in with $100,000 home sales. The average price comes in around $500,000– a gross distortion of both markets.
Here’s a real-world example of what has happened in hot markets over the past 20 years. The house in question is located in a bedroom community suburb in the San Francisco Bay Area metro area. The home was built in 1916 and has 914 square feet, no garage and a small lot.
It sold in 1996 for $135,000. This was a bit under neighborhood prices due to the lack of garage and small size, but nearby larger homes sold in the $145,000 to $160,000 range.
The house was sold in 2004 for $542,000, and again in 2008 for $575,000. It is currently valued at $720,000. The neighborhood average is $900,000.
According to the Bureau of Labor Statistics inflation calculator, inflation since 1997 has added 50% to the cost of living: $1 in 1997 equals $1.50 in 2016.
Adjusted for inflation of 2.5% annually, calculated cumulatively, the home would be worth a shade over $220,000 today. Long-term studies have found that housing tends to rise about 1% above inflation annually, so if we add 1% annual appreciation (3.5% calculated cumulatively over the 20 years), the home would have appreciated about $47,000 above and beyond inflation, bringing its value to $268,000–almost double the purchase price.
But being in a hot market, this little house appreciated a gargantuan $450,000 above and beyond inflation and long-term appreciation of 1% annually.
Those who bought in hot markets are $500,000 richer than those who bought in not-so-hot markets.
Another house I know in a hot metro market sold for $438,000 in 1997 and is currently valued at $1.4 million. The owners picked up substantially more than $500,000 in bonus appreciation.
Or how about a home that sold for $607,000 in 2010 and is now valued at $960,000? (Note that I have picked neighborhoods and metro areas I have known for decades, so I can verify the current valuations are indeed in the real-world ballpark.)
Inflation alone added about $60,000 to the value since 2010; the $300,000 appreciation above and beyond inflation is pure gravy for the owners.
It’s easy to dismiss these soaring valuations as credit-driven bubbles that will eventually pop, but that narrative misses the enormous differences in regional incomes and GDP expansion. The little 900 square foot house that’s barely worth $100,000 in most of the country may well fetch $700,000 in hot markets for far longer than we might expect if it is in a metro area with strong GDP and wage growth.
|
To understand why, look at these three maps of the U.S. The first reflects the GDP generated within each county; the second shows real growth in GDP by region, and the third displays the wages of the so-called “creative class”–those with high-demand skillsets, education and experience.
|
GDP Count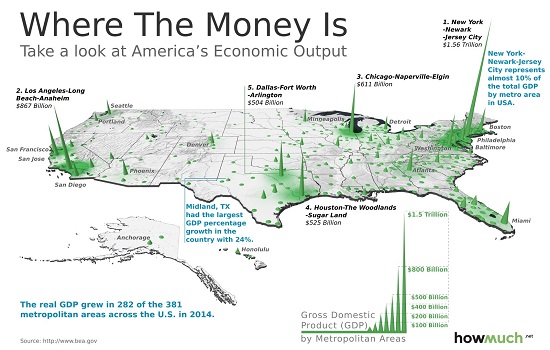 - Click to enlarge |
|
The spikes reflect enormous concentrations of GDP. This concentrated creation of goods and services generates jobs and wealth, and that attracts capital and talent. These are self-reinforcing, as capital and talent drive wealth/value creation and thus GDP.
|
GDP Metropolitan Area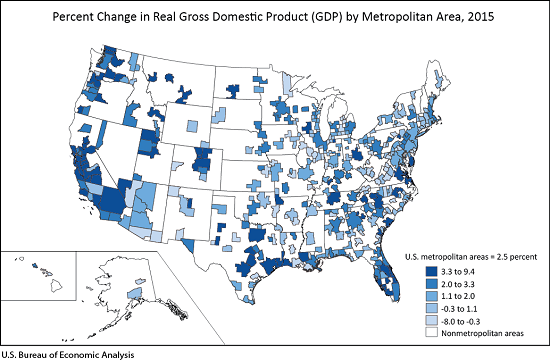 - Click to enlarge |
|
Unsurprisingly, there is significant overlap between regions with high GDP and strong GDP expansion. The engines of growth attract capital and talent.
|
Creative Class Wages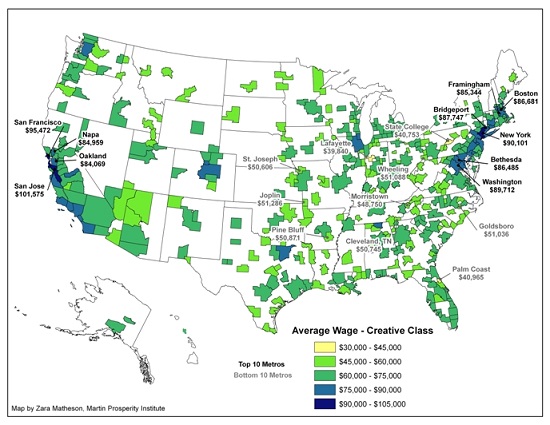 - Click to enlarge |
Creative class wages are highest in the regions with strong GDP expansion and concentrations of GDP, capital and talent. Attracting the most productive workers requires hefty premiums in pay and benefits, as well as interesting work and opportunities for advancement.
That people will make sacrifices to live in these areas should not surprise us–including paying high housing costs. This willingness to pay high housing costs attracts institutional and overseas investors, a flood of capital seeking high returns that further pushes up the cost of housing.
The rising cost of money will impact all housing. So will recession. But if we had to guess which areas will likely experience the smallest declines in prices and recover the soonest, which markets would you bet on?
Markets that are “cheap” because wages are low and opportunities scarce, or high-cost areas with high wages and concentrations of the factors that drive growth and innovation?
The point is that hot housing markets are hot for reasons beyond low interest rates for mortgages. These islands of concentrated capital, GDP growth and talent are magnets that attract global capital and talent, even as prices notch higher.
My new book is The Adventures of the Consulting Philosopher: The Disappearance of Drake. For more, please visit the book's website.


Full story here
Are you the author?
At readers' request, I've prepared a biography. I am not confident this is the right length or has the desired information; the whole project veers uncomfortably close to PR. On the other hand, who wants to read a boring bio? I am reminded of the "Peanuts" comic character Lucy, who once issued this terse biographical summary: "A man was born, he lived, he died." All undoubtedly true, but somewhat lacking in narrative.
Tags: newslettersent