EUR/USD
The US dollar recovered from the sell-off sparked by the poor employment data released on June 3. It continued to move higher after the Federal Reserve met and shaved its forecasts for the next year and 2018. The number of Fed officials that think only one hike may be appropriate this year increased from one in March to six in June. The market is discounting less than a one in 10 chance of a July hike, though a upward revision to the May jobs data coupled a robust June report would likely see the perceived risks increase.
The dollar staged a reversal of sorts following the assassination of the UK member of parliament, Jo Cox There was more dollar selling the following day. It appeared that the senseless killing spurred an adjustment of the risk-off positioning that had been gaining momentum earlier in the week.
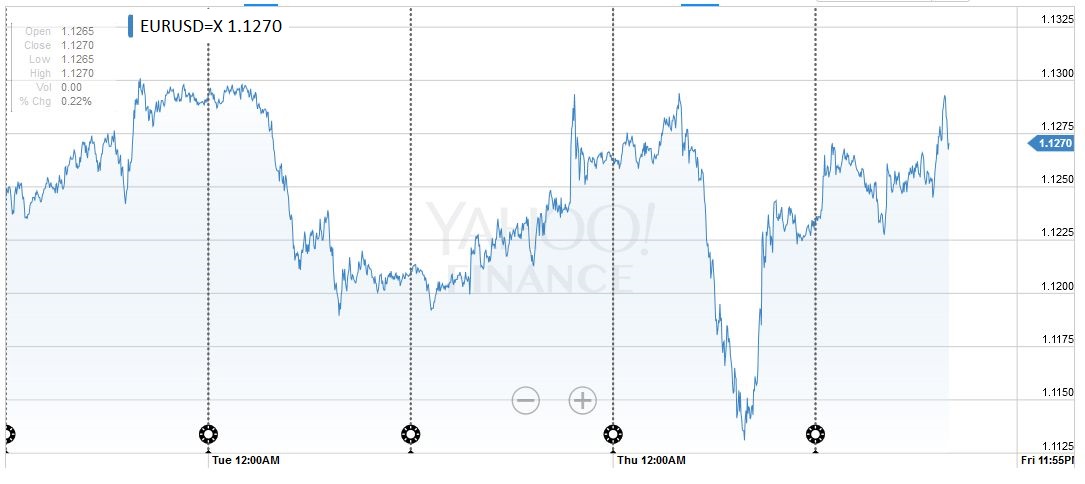
The euro was capped every session last week within 5 ticks of $1.1300. A move above, say $1.1310, could see the euro move toward $1.1400-$1.1420. On the downside, a break of $1.1100 is needed to signify anything important from a technical perspective. The trendline drawn off the last-December’s low (~$1.0525) and the March low (~$1.0820) and held on June 16 spike lower (~$1.1130). That trendline is found near $1.1135 June 23 the day of the UK referendum.
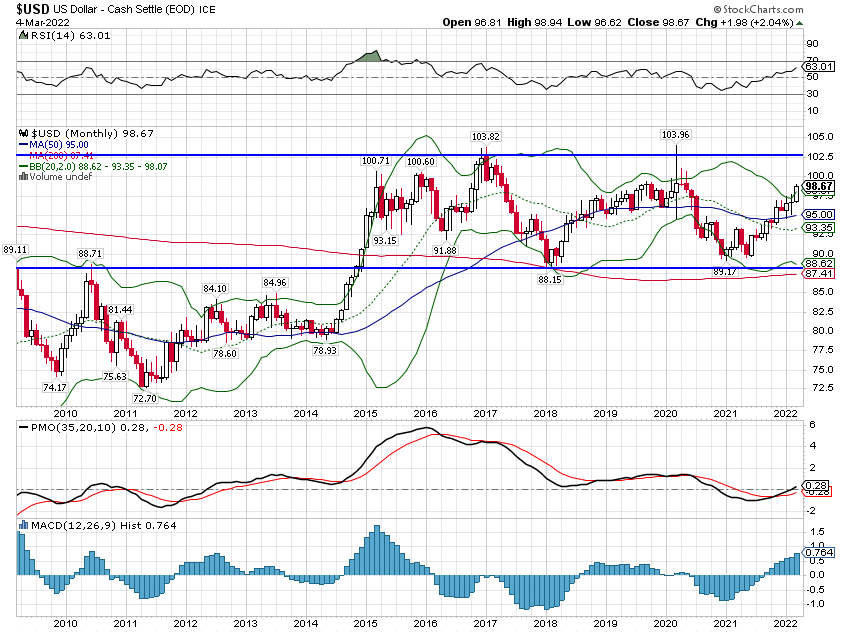
The US dollar’s near-term technical tone look fragile. The US Dollar Index advance was stopped by a trendline drawn off the February, March, and May highs. It was found near 95.40 on June 16. The high that day was 95.32. With the pre-weekend losses, the Dollar Index retraced 61.,8% of the rally since June 8 (~94.15). The next target is near 93.40. A break of that area would be particularly negative, warning of the risk of a move toward 92.00.
|
FX Rates June 13 to June 17, 2016
 click to enlarge |
USD/JPY
The yen was the strongest of the majors last week, rising 2.6% against the dollar. The greenback fell to JPY103.55 following the dovish tilt at the Fed and the BOJ’s decision to stand pat, amid a continued downdraft in equities. There is no compelling technical indication that a low of any significance is in place. The risk now extends toward JPY100.60, which represents a 50% retracement of the dollar’s gain against the yen that are associated with Abenomics. The previous low around JPY105.50 may now act as resistance.
|
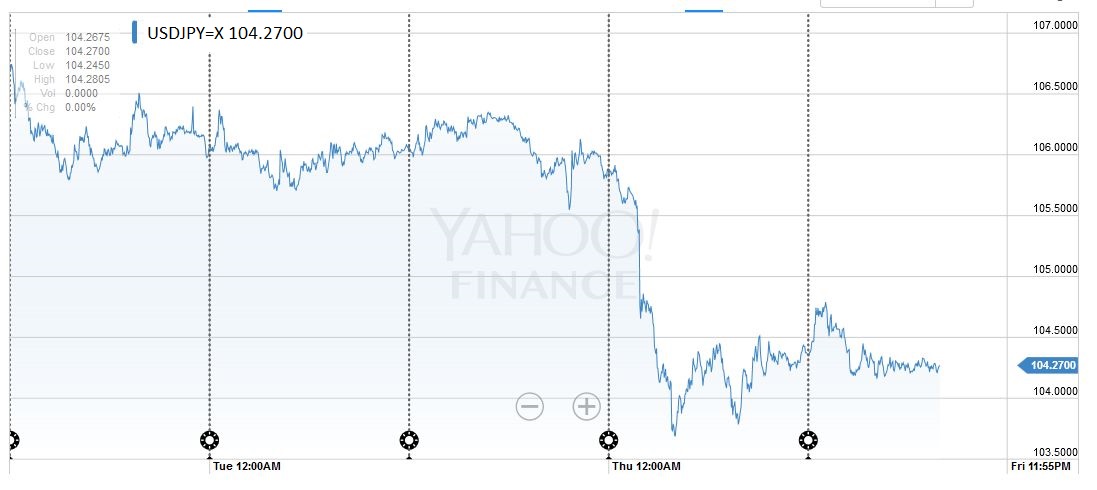 click to enlarge |
GBP/USD
The resumption of the referendum campaigns and new polls will be seen over the weekend. The referendum itself is the key event next week. There is bound to be a dramatic reaction regardless of the results. This prospect may keep the markets relatively quiet after the initial response to the weekend events (polls, speeches, and the run-off in Italy’s local and municipal governments).
Sterling manage to eke out a modest (~0.4%) gain on the week against the US dollar. It staged a dramatic reversal after trading within a few ticks of the $1.40 level on June 16. The bounce carried sterling to near the 50% retracement of the last leg down that began June 7 from $1.4660. That retracement is found around $1.4335. A move above there targets $1.4410 and $1.4445. The latter corresponds to the 61.8% retracement objective and the 20-day moving average respectively. On the downside, initial support is pegged near $1.4165. |
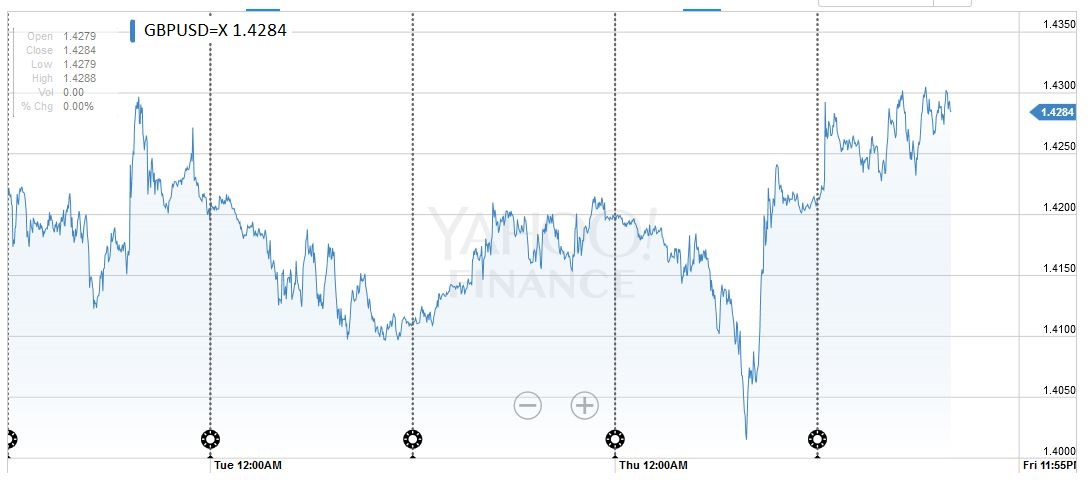 click to enlarge |
AUD/USD
The Australian dollar was the second strongest major currency last week, gaining 0.4% against the greenback. This represents a smart recovery from a low near $0.7285 on June 16, which is almost a cent below the previous week’s close. Resistance is seen in the $0.7440 area and then $0.7500.
|
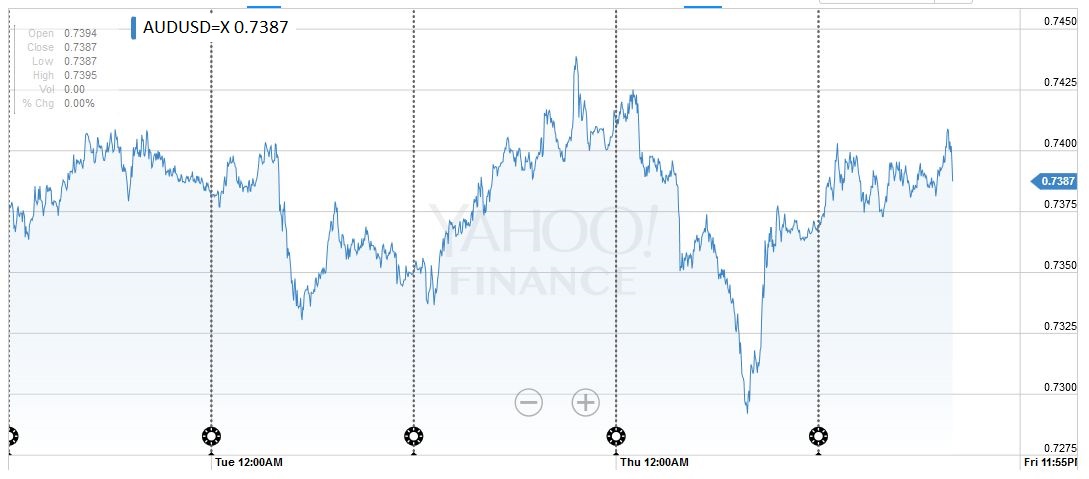 click to enlarge |
Oil
Oil snapped a six-session fall before the weekend. This coupled with the broader corrective forces saw the US dollar pare its gains against the Canadian dollar. It was the best performing currency on June 17, gaining 0.9% against the US dollar, but it still finished the week with a 0.65% loss, making it second worse major currency for the week. Still, the greenback’s pullback retraced 61.8% of the gains recorded from the CAD1.2655 level on June 8 to the spike hike last week to CAD1.3085. That retracement is found at CAD1.2820. Consolidative trading seems the most likely scenario.
The continuation futures light sweet crude oil futures contract broke below the four-month uptrend line in the middle of last week. The July contract fell to just below $45.85, one-month lows, before the weekend and then rallied over 3%. The trendline comes in now a little above $48.00, corresponding to the 38.2% retracement of the recent decline. Above there is $48.75, which is the 50% retracement, but also the 20-day moving average (~$48.95) and recent congestion.
|
Crude Oil Prices June 13 to June 17, 2016
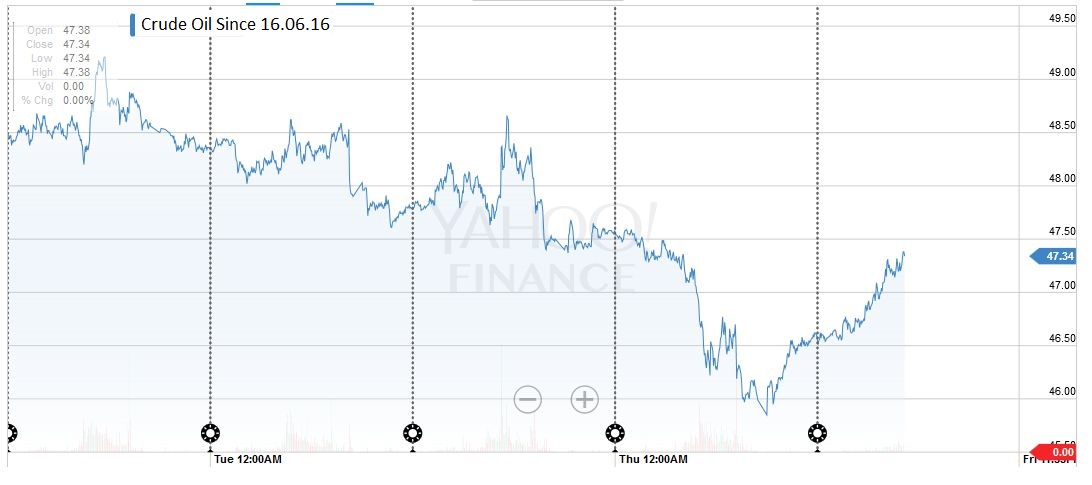 click to enlarge |
US Treasuries
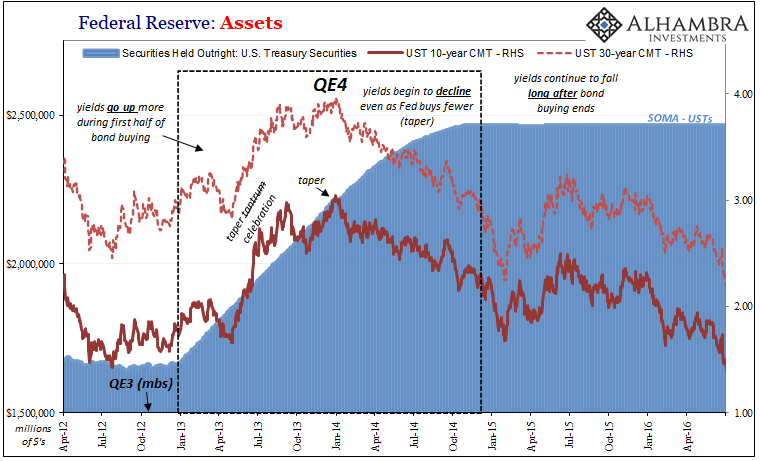
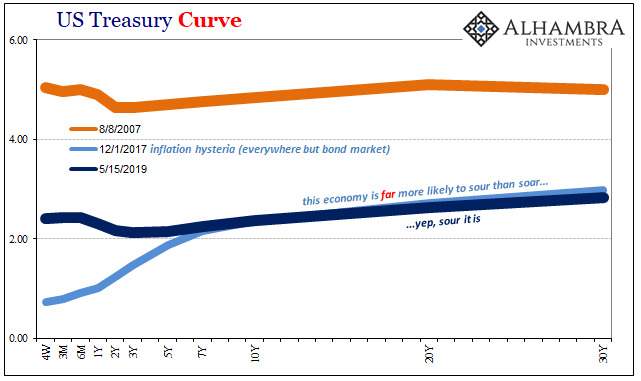
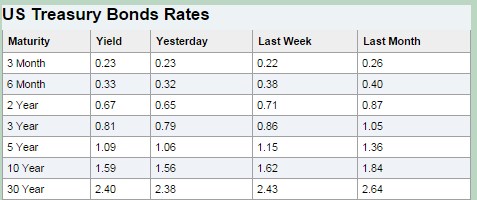
The US 10-year yield fell to almost 1.50% before dramatically recovering on June 16. The yield chart had an usual occurrence before the weekend. The yield gapped higher, according to Bloomberg data. The September note futures contract did not gap lower but still traded heavily against of the weekend. The price was lower than it was on June 15 after the FOMC meeting. The technical indicators are mixed, but a further pullback in prices (rise in yields) in the first part of next week ought not surprise. |
 |
S&P500
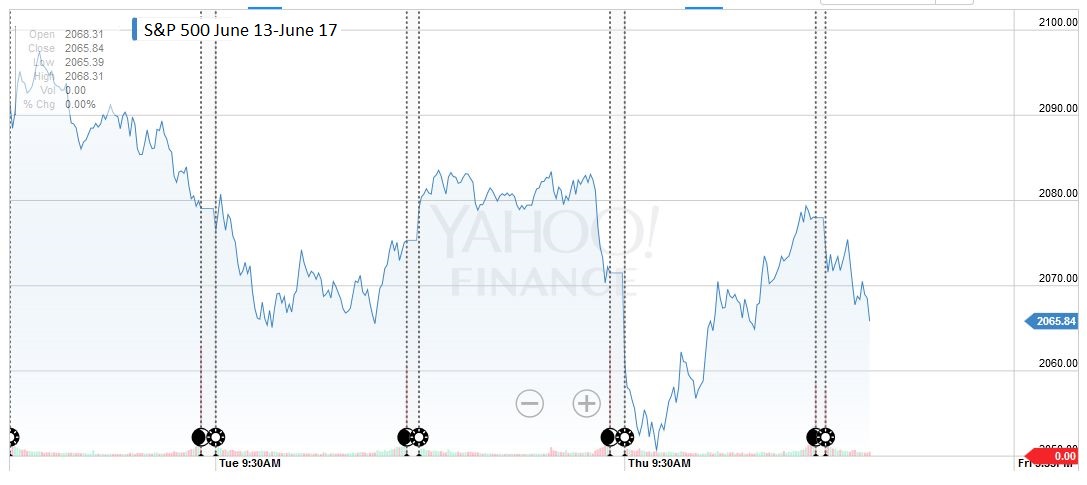
The S&P 500 traded in narrow ranges most of last week and lost about 1.4%. The technical tone looks fragile. However it takes a break below 2050 to be meaningful. That area also houses the lower Bollinger Band. There is congestion support around 2040. Last month’s low was recorded near 2026. A push below there would bring it view an area not see since March.
|
 click to enlarge |


