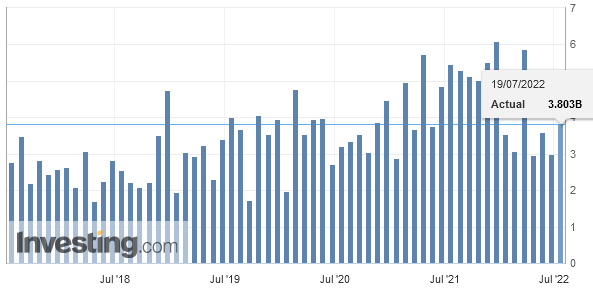
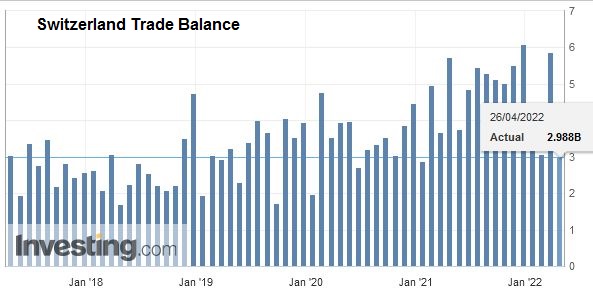
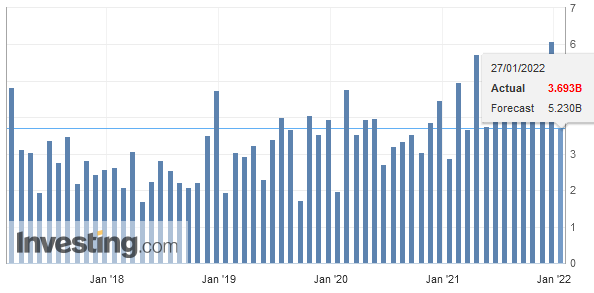
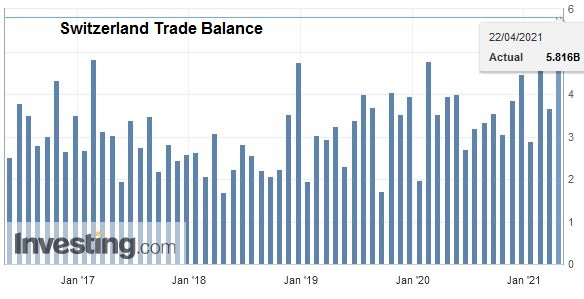
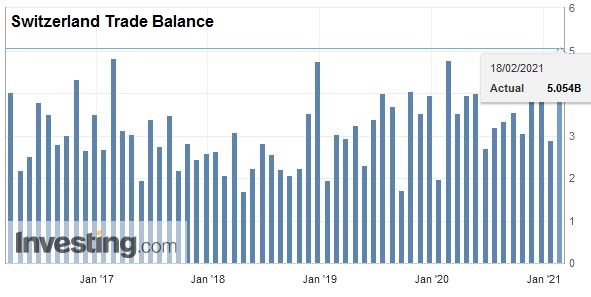
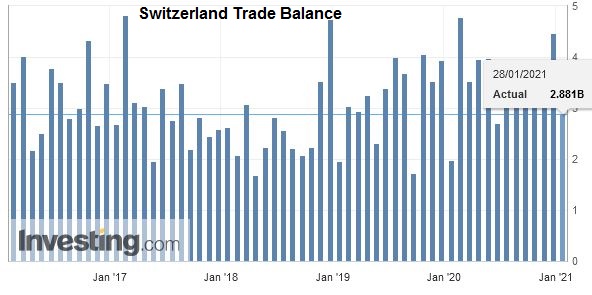
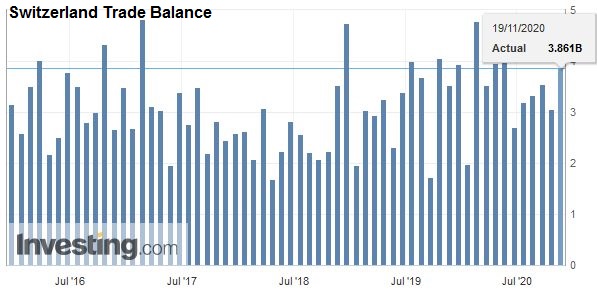
We do not like Purchasing Power or Real Effective Exchange Rate (REER) as measurement for currencies. For us, the trade balance decides if a currency is overvalued. Only the trade balance can express productivity increases, while REER assumes constant productivity in comparison to trade partners.
On the other side, a rising trade surplus may also be caused by a higher savings rate while the trade partners decided to spend more. Recently Europeans started to increase their savings rate, while Americans reduced it. This has led to a rising trade and current surplus for the Europeans.
To control the trade balance against this “savings effect”, economists may look at imports. When imports are rising at the same pace as GDP or consumption, then there is no such “savings effect”.
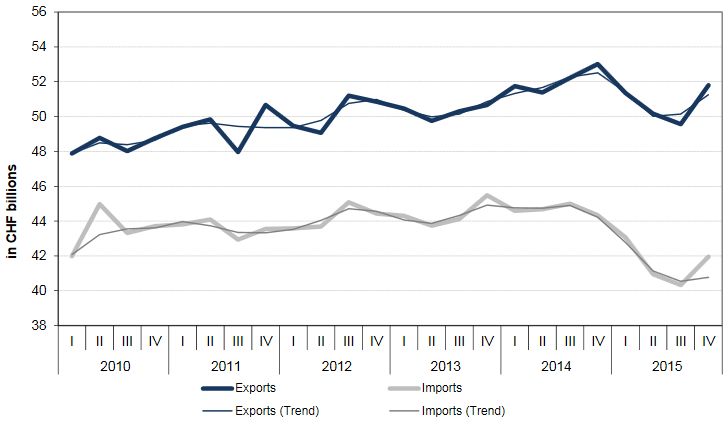
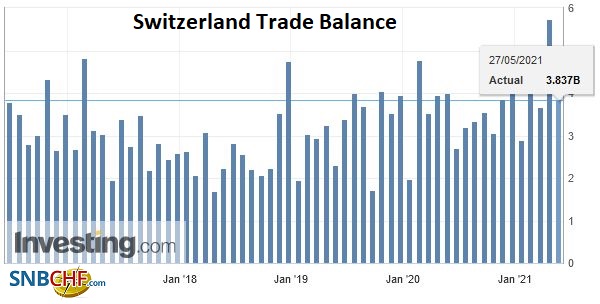
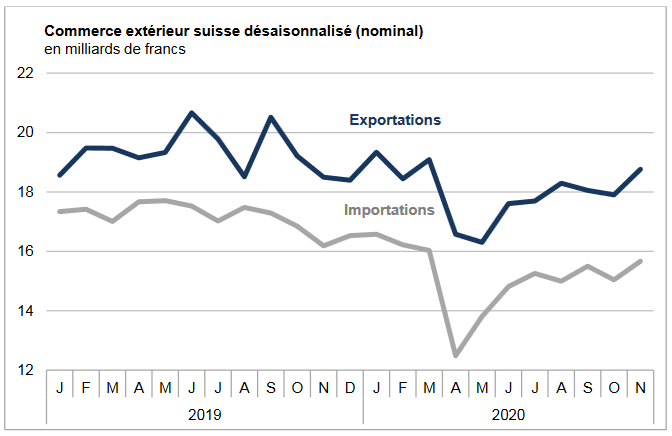
After several years of moderate growth, exports (-2.6%) and imports (-6.9%) fell in nominal terms in 2015. Nevertheless, exports were at their third-highest level ever at CHF 202.9 billion. Prices clearly declined, particularly for imports, against the backdrop of the strong Swiss franc. Consequently, there was a slight drop in real terms for both exports and imports (-0.7% and -0.5%). The trade surplus once again reached a record of CHF 36.6 billion.
|
December 2015: additional working day leads to more exports
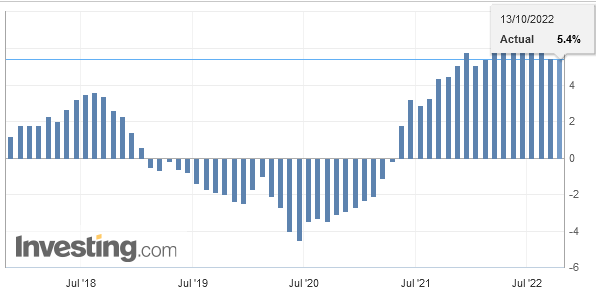
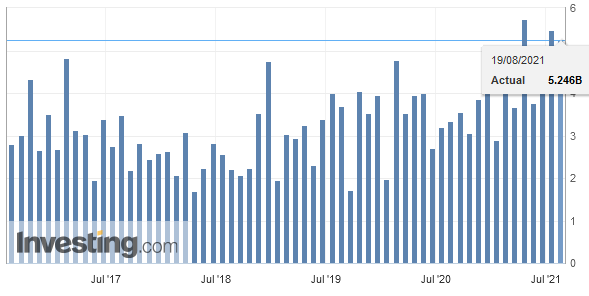
Exports rose in both nominal and real terms in the last month of 2015, whereas imports continued to fall. However, there was one more working day in December 2015 than in December 2014. Adjusted for working days, exports fell by 2.1% (real: -1.1%), and the decline in imports reached 9.1% (real: -6.3%). The prices of exported goods dropped by 1.0% and those of imported goods fell by 3.0%. The trade surplus amounted to CHF 2.5 billion.
|
Switzerland Trade Balance, December 2015(see more posts on Switzerland Trade Balance, )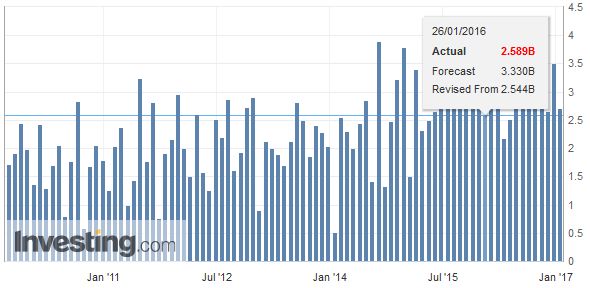 Source: Investing.com - Click to enlarge |
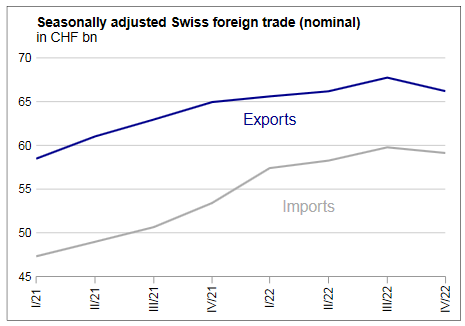
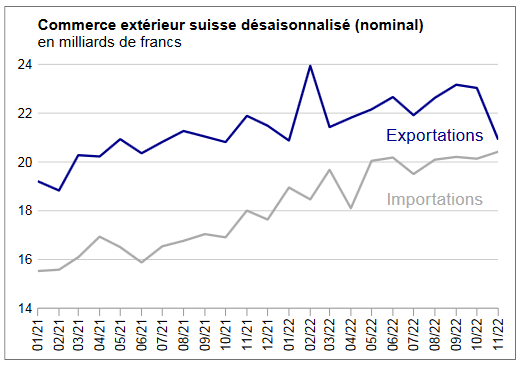
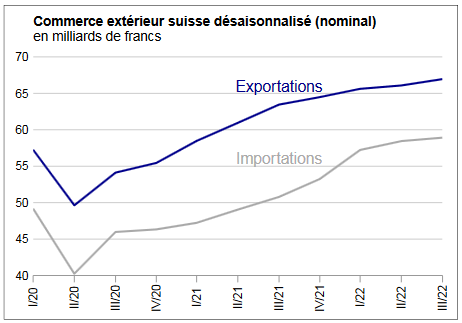
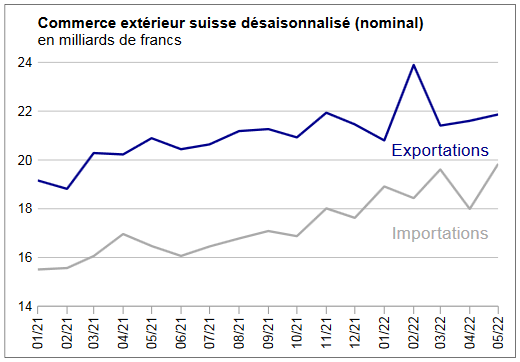
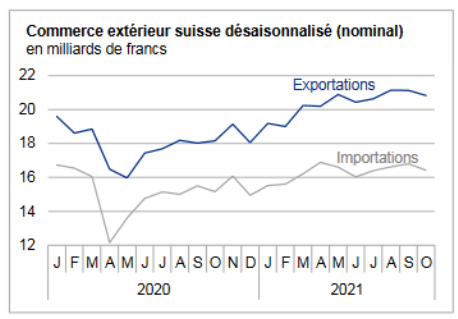
Exports and Imports YoY DevelopmentBased on the seasonally adjusted figures, exports had a negative trend in nominal terms in the first three quarters of 2015, but this was continuously weakening. They then picked up in the fourth quarter in both nominal and real terms, thereby giving a glimmer of hope.
Imports moved in a similar manner, and they too started to increase in the fourth quarter.
▼ Lower exports: machine industry accounted for two fifths of total decline
▼ Eurozone: exports down CHF 6 billion; imports down CHF 10 billion
▲ Foreign trade with USA and China at record levels for second time in succession
▲ Glimmers of hope in Q4 2015
|
Swiss Exports and Imports, Seasonally Adjusted (in bn CHF)(see more posts on Switzerland Exports, Switzerland Imports, ) |
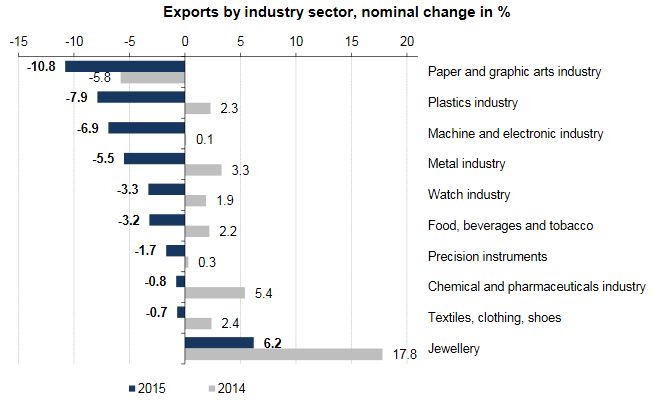
Sector FindingsIn 2015, exports posted a year – on – year decline of 2.6%, or CHF 5.5 billion, to reach CHF 202.9 billion. In real terms, there was a slight drop of 0.7%. Sector performance was rather mixed, ranging from – 11% (paper and graphic arts industry) to +6% (jewellery). Nonetheless, most sectors posted distinctly lower turnover against the backdrop of falling prices.
Shipments from the plastics industry were down by 8%. Machine and electronic industry exports fell by 7% (real: -4%), following two preceding years of stagnation. Sales of textile machines (-21%) and non – electrical engines (-17%) suffered significantly. Moreover, deliveries of thermos and refrigeration engineering as well as pumps and compressors fell by approximately 10%. Metal industry shipments were down by 6% (real: +0.7%); sales of iron and steel in particular fell due to price factors (-16%). Following the previous year’s record high, watch industry exports declined by 3% to CHF 21.5 billion in 2015. Food, beverages and tobacco industry exports fell to the same extent, although beverage deliveries rose by 3%. The largest branch, coffee, meanwhile posted a decline of 5%. Precision instrument exports decreased by 2%, although medical instruments and equipment posted a slight year – on – year increase (real: +7%). Chemical and pharmaceuticals industry exports fell by almost 1% (real: +2%) to CHF 84.6 billion. Consequently, the largest export sector once again slightly increased its share of total exports to 42% in 2015. While sales of active pharmaceutical ingredients decreased by 8%, deliveries of medicines increased by 2% and those of immunological products stagnated. The increase in sales of agro chemical products is also worth mentioning (+6%).
Swiss imports amounted to CHF 166. 3 billion (-6.9%) in 2015, which was CHF 12.3 billion lower than the previous year’s figure in value terms. The prices of imported goods fell by a total of 6.4%, whereas imports stagnated in real terms (-0.5%). All of the main groups of goods were down. Energy sources posted the biggest reduction, with imports plunging by 30% in nominal terms due to sharply falling prices (real: +2.9%).
There was also a considerable decline in the area of raw materials and semi-manufactures (-9%, or CHF -3.9 bn). This was widely spread across the various branches. In the two largest subgroups, chemicals and metals, imports dropped by 11% each in value terms (real: +2%). However, imports of plastics also fell by 9%.
Imports of capital goods decreased by 4%, or CHF 1.8 billion. There was an above-average decline in imports of machines, e.g. mobile or semi-mobile production machine and devices, production machinery and prime movers, as well as building requisites goods. In contrast, aircraft purchases increased by more than a third.
In the area of consumer goods, imports were down by 4%, or CHF 3.1 billion. Pharmaceutical products, by far the largest subgroup, accounted for more than 90% of the drop (-9%, or CHF -2.9 bn). While consumer electronics imports also declined, car imports rose by 4% (units: +10%) and those of jewellery and watches increased by 9% and 10% (returned goods), respectively.
|
Swiss Exports by Industry Sector, YoY 2015(see more posts on Switzerland Exports, Switzerland Exports by Sector, ) |
|
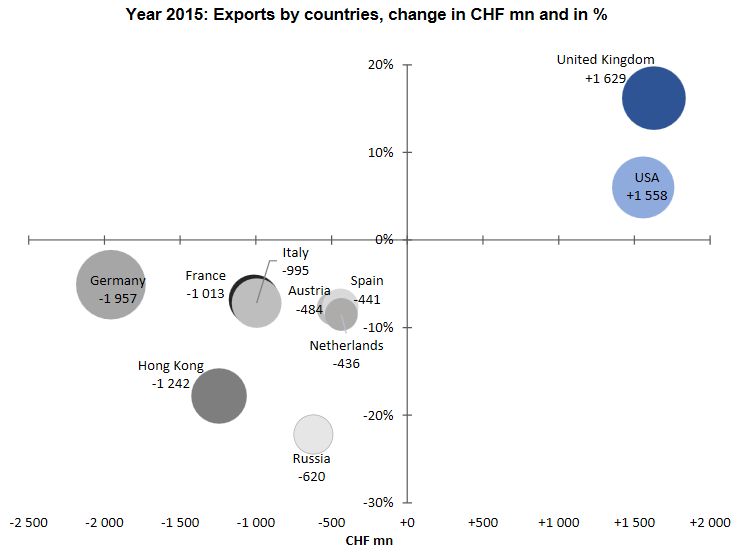
While exports to North America rose (+5%; USA: +6% to reach a new high) and those to Asia stagnated, Switzerland exported fewer goods to the other continents. For example, exports to Africa dropped by 13% and those to Europe shrank by a total of 5% (EU: -4%) to reach CHF 114.7 billion. Exports to Russia plunged by 22%. A series of countries, including Austria, Spain, Italy and France, saw a decline in sales of 7% to 9%. Shipments to Germany fell by 5%, while those to the United Kingdom increased by a sixth (pharmaceuticals). In Asia, sales to China, Japan and India edged up by between 1% and 4%, and those to Singapore and Saudi Arabia grew by 9% and 19% (aircraft), respectively. However, the sharp decline of 18% in Hong Kong (watches) dragged down the overall result. Latin American sales were down by 5%, with exports to Mexico falling by 17%.
|
Swiss Exports per Country YoY 2015(see more posts on Switzerland Exports, Switzerland Exports by Country, ) |
|
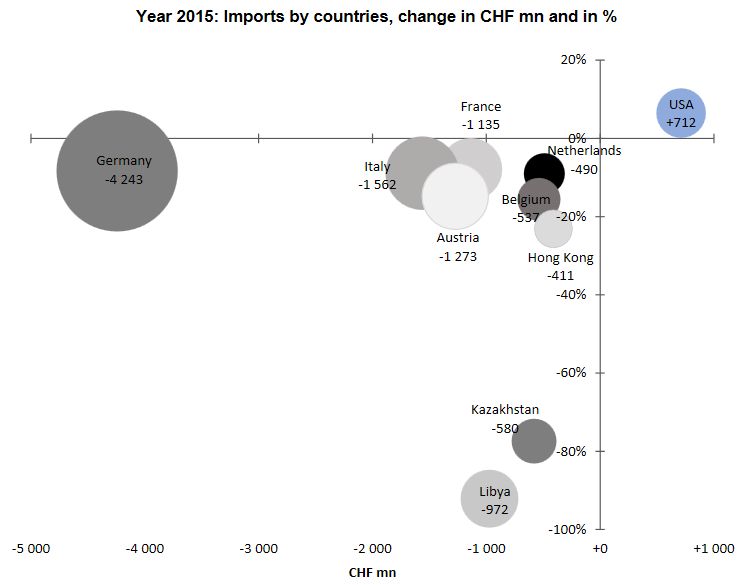
Imports from North America were the only ones to increase (+5%; USA: +7%). Meanwhile, imports from Africa halved because of the collapse in crude oil purchases from Libya and Nigeria and thus reached their lowest level in 15 years. Deliveries from Europe declined by a total of 8% (EU: -8%), coming in at more than CHF 10 billion lower than the previous year’s level. Significant reductions were seen in imports from Austria (-15%; pharmaceuticals), as well as those from the heavyweights of Italy, Germany and France, which saw a decline of 8% to 9% in value terms. In contrast, imports from the United Kingdom edged up by 2%. Imports from Latin America fell by 5% (Brazil: -11%) and those from Asia by 4%. Imports from Hong Kong (-23%; jewellery), India (-10%) and Japan (-9%) plunged, while those from China were up by 2% and those from Singapore actually increased by 34% (jewellery).
|
Swiss Imports per Country YoY 2015(see more posts on Switzerland Imports, ) |
Full story here Are you the author? Previous post See more for Next post
Tags: Switzerland Exports,Switzerland Exports by Country,Switzerland Exports by Sector,Switzerland Imports,Switzerland Imports by Sector,Switzerland Trade Balance


