Marc Chandler
My articles My offerMy siteAbout meMy videosMy books
Follow on:LinkedINTwitterSeeking AlphaAmazon
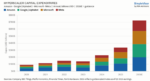
This Great Graphic was composed on Bloomberg. It shows two time series. The yellow line shows the premium the US pays over Germany for two-year money. The white line shows the premium the US pays over Japan for two-year money.
The premiums have risen sharply since mid-October and today are at new multi-year highs. In the middle of October the US premium over Germany was near 80 bp. Today it was near 136 bp. Although the German 2-year yield has fallen below -40 bp, it is the US side that accounts for most of the movement over the past month. The US two-year yield has risen almost 30 bp over the past month. The German yield fell by almost 10 bp.
German yields are negative out through six years. In fact, yields out to four years are lower than the ECB's deposit rate, which effective excludes them from QE operations. Draghi's dovish comments fueled anticipation of action next week, and in effect, forcing the ECB to cut the deposit rate further of face greater difficulty securing sufficient German instruments for purchase.
Japan's yield curve is slightly negative through three-years. Japan's two-year yield has slipped a couple basis points over the past month to yield minus 3 bp. The US premium over Japan for two-year borrowing was dipped below 54 bp in mid-October. Today it is near 95 bp.
Some non-yen based investors are finding it lucrative to buy a short-term JGB and swap the yen into dollars to earn more than one can earn from buying a similar dollar maturity outright. US companies have been heavy issuers of euro-denominated bonds and are swapping their proceeds back into dollars, making for cheap funding.
Before the crisis hit, the US two-year premium over Germany was near 175 bp. This is the next major target. In the second half of the 1990s, as the Clinton dollar rally gained momentum, the US premium peaked near 275 bp. In 2006, the US two-year premium over Japan peaked near 430 bp. While this seems to be unreasonable in the foreseeable future, the US premium will likely increase further, and a 150 bp spread does not require too much of an imagination.
Conceptually, we can understand that a particular event can be discounted by the market, which is an incredible anticipatory mechanism. However, investment and hedging decisions for next year or 2017 will be influenced by the incentive structure created by the interest rate differentials and slopes of curves. The claim that the market has discounted the divergence of monetary policy does not ring true to us. The growing premium the US offers creates an ongoing incentive to be long dollars. Moreover, we have learned from Dornbusch that overshoot in the currency markets are part of the cycle. Here is a link to a paper by Rogoff explaining the importance of Dornbusch's work.
He has been covering the global capital markets in one fashion or another for more than 30 years, working at economic consulting firms and global investment banks. After 14 years as the global head of currency strategy for Brown Brothers Harriman, Chandler joined Bannockburn Global Forex, as a managing partner and chief markets strategist as of October 1, 2018.
Tags: Kenneth Rogoff