Weekly Overview of FX Rates Movements
The week was driven by the following factors:
- Solid Chinese economic data including a 7.8% rise in GDP.
- The end of the debt ceiling debate, at least for now.
- The expectation by the Fed member Evans that the government shutdown has delayed Fed tapering. San Francisco Fed’s Williams even speaks of a longer time of forward guidance: Reasons are the unemployment rate of 7.3% that is still far above the (for him) natural rate of unemployment of 5.5% and the inflation rate well under 2%.
- The upcoming debt ceiling debate in January 2014 may delay tapering again.
- Relatively high U.S. unemployment initial claims (358K vs. 335K expected) and a better than expected Phily Fed manufacturing index.
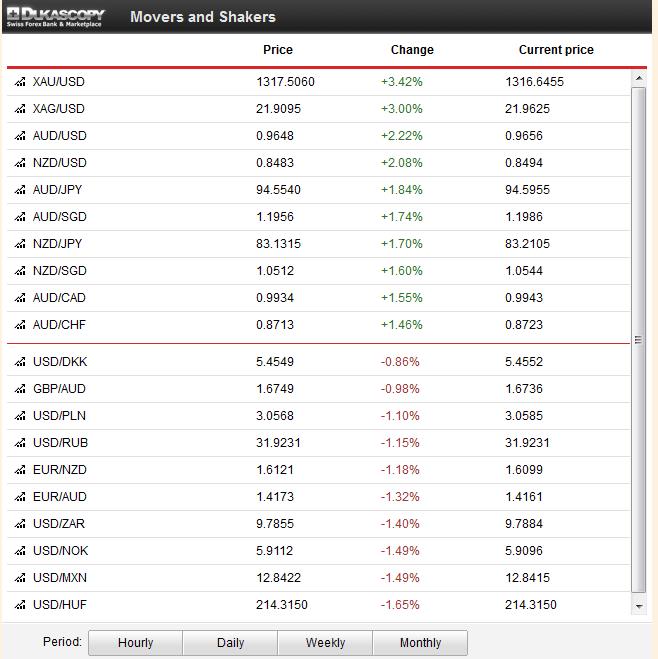
As a consequence, gold, silver and the risk-on currencies of the Asian bloc, namely AUD, NZD and NOK appreciated, while the dollar weakened. Together with its friends in the Asian bloc, CHF also inched up: USD/CHF depreciated by 1% from 0.9122 one week ago to 0.9021. As usual EUR/CHF followed the weaker USD and fell from 1.2350 to 1.2344 during the week.
Fundamental data from China have become main drivers of FX rates. We provide an analysis based of last week’s Chinese “data dump” and try to understand its global implications. This dump contained trade data, inflation data, credit data and GDP. Finally we take a look on the ratio of retail sales to industrial production, an indicator of the “global imbalances”.
Fundamental data from China have become main drivers of FX rates and global stock markets. We provide an analysis based of last week’s Chinese “data dump” and try to understand its global implications.
This dump contained trade data, inflation data, credit data and GDP. Finally we take a look on the ratio of retail sales to industrial production, an indicator of the “global imbalances”.
Trade data
Chinese trade data for September, especially the rising imports (+7.4% y/y vs. 7.0% in August) were positive for Brent oil, silver and gold, because they anticipate future industrial production.
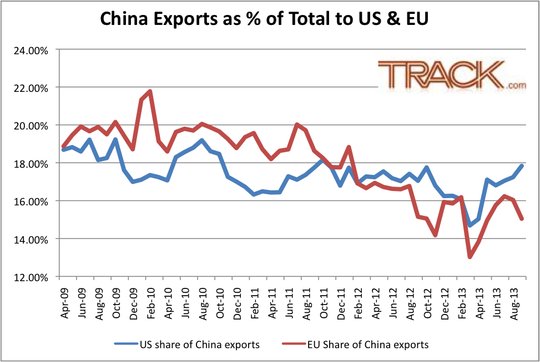
The QE3 and spending-based “US recovery” helped that Chinese exports to the United States sharply increased in 2013, but the ones to austerity-driven Europe and many Emerging Markets fell again.
Inflation data
The Chinese producer price index (PPI) came in with minus 1.3% YoY, while the purchaser price index at -1.6% was nearly identical. The small difference between the two is an indication that companies are able to compensate higher wages with investment and innovation.
Given that the Renmimbi was 3% stronger against the dollar but 3% weaker vs. the euro in the last year, implies that the currency had hardly an influence. Despite the slight Renmimbi weakness against the euro, the Chinese PPI fell, with -1.6% YoY, more than many in the European periphery: Italy has a PPI of -2.3%, Spain -0.1%, Greece -1.8%, Portugal -0.2%, Ireland +3.0% compared to Germany -0.4%. This implies that the structural reforms in the periphery will take a long time, replacing Chinese or German goods by local production will be difficult.
In September, the Chinese CPI increased by 3.1% YoY. This is the highest value since May 2012 and implies that further easing measures by the PBoC should not come.
Credit and Foreign Direct Investments
The increase of Chinese money supply M2 was 14.2% compared to 6% in the U.S. or 4% in the eurozone or 3.8% in Japan. The official data for loans (excluding shadow banking) rose by 557 bln. CNY to 7280 bil. in the first three quarters, +7.6%. This is as much as the 8% credit growth in the United States (source FRED) and far higher than the falling credit to euro area residents (minus 0.5% YoY). We do not understand the criticism by the Financial Times that credit growth was excessive in China, but apparently not in the United States.
Credit always has one person that borrows and a second that lends. Foreign investment (FDI) data seems to show that both the outflows in 2012 and the inflows this year are driven by local investors and not by foreigners that lend to China.
From the Financial Times, Fast FT:
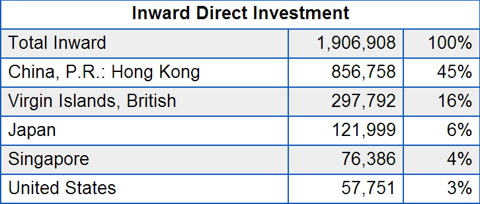
Foreign direct investment into China rose 4.9 per cent in September, year on year. That missed expectations, but this statistic is hard to fathom because it can be skewed by illicit money flows. China’s second largest foreign investor is the British Virgin Islands, a tiny low tax jurisdiction in the Caribbean. Its biggest investor is Hong Kong, the Chinese financial centre, according to IMF statistics (see chart) for 2011, the most recent available. Washington non-profit Global Financial Integrity said in a report last year that Chinese citizens used Hong Kong and the BVI to disguise illicit money flows that were dressed up as foreign investment. The renminbi is not freely exchangeable and there are limits on how much domestic currency Chinese citizens can invest abroad each year. Mainland Chinese business owners who wish to invest abroad and repatriate the cash can sometimes pretend overseas income is FDI into their companies, GFI alleges.
A 2004 report written for the Asia Development Bank said much the same thing.
From the GFI report:
A lot of ilicit money…leaves China as FDI in[to] places like Hong Kong and the British Virgin Islands (BVI), only to then be laundered into another entity and reinvested in China as FDI from Hong Kong or the BVI.
[This scheme can] allow high net worth individuals HNWIs) to secretly accumulate wealth in contravention of government regulations and oversight.
Despite its status as a developing country – the Chinese Net International Investment Position is positive. Therefore, the increase of 7.6% in lending is rather a small value for a developing country like China.
China’s GDP
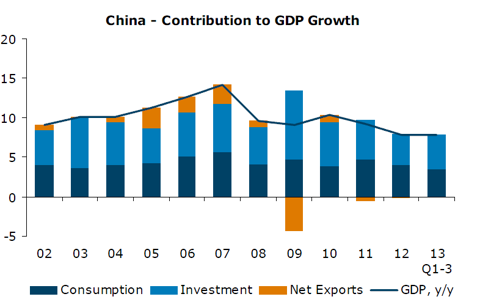
The increase of 7.8% YoY for Chinese GDP was higher than the previous two quarters. The QoQ value was 2.2.% vs. 1.7% in Q2. According to analysts, the increase was caused by a “mini stimulus program”, an investment program organized by the government.
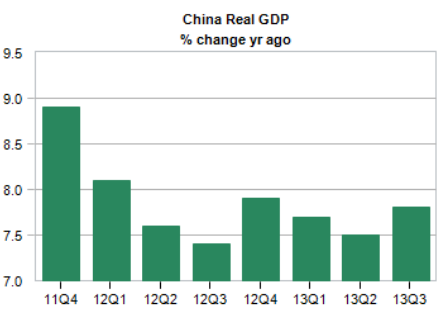
The following graph from the ANZ Banking Group shows that – as opposed to the period until 2008 – net exports do not add to GDP growth. This means that global imbalances caused by China were not increasing until recently. On the other side, Chinese growth is still driven by investments.
The rising European current account surpluses, however, are an expression of a new period of global imbalances. But austerity and the resulting trade surpluses – e.g. in Italy – were necessary to eliminate the fear factor in financial markets that could find repercussions in the real economy. On the other side, lower spending does not point to a fundamental recovery of Southern Europe at all.
Shrinking Difference between China’s Retail Sales and Industrial Production Points to Future Imbalances
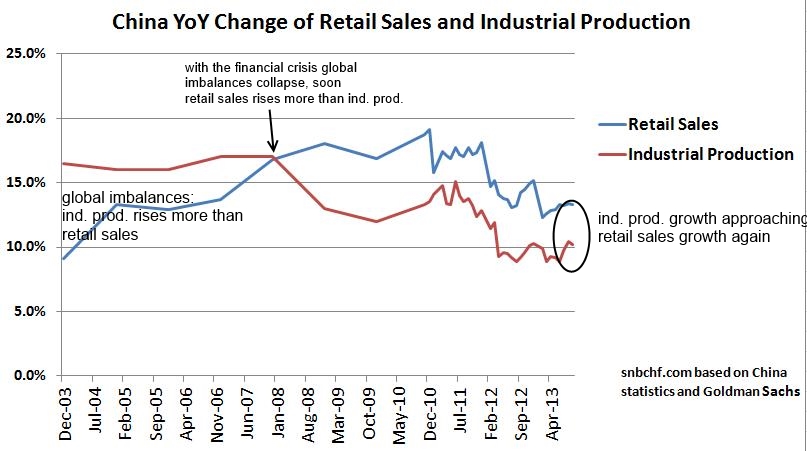
The following is measurement often used by Goldman’s Jim O’Neill. It describes the relationship between growth of retail sales and industrial production. Industrial production stands for the demand of the global economy for (cheap) Chinese goods and retail sales for local Chinese consumption.
The higher the difference between growth of industrial production and retail sales, the higher are the global imbalances. Since the financial crisis retail sales is rising more quickly, the crisis reduced global imbalances.
But in the recent months industrial production is increasing far more than retail sales. This might imply increasing global imbalances. The Chinese are spending less than previously but they are producing more for global customers.
.
.
Investment recommendation
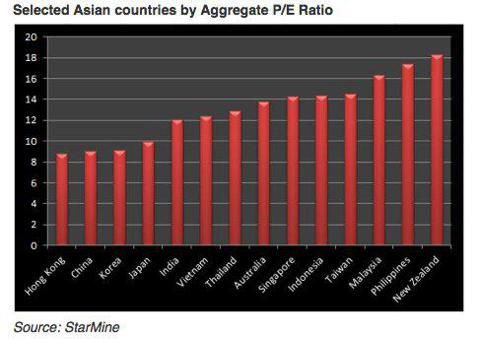
Chinese equities remain undervalued compared to other stock markets.
As opposed to some other emerging markets we do not see any Chinese structural weakness, the PPI shows that costs and wage increases are under control. We recommend large Chinese caps (FXI) or alternatively the Guggenheim China Small Cap ETF (HAO).
If global imbalances accentuate again then Chinese exporters will take profit on it and it will be time to increase the share of selected emerging markets again. If these imbalances diminish then the local consumer will become more interesting. A win-win game for Chinese stocks.
Tags: Asian bloc,China Consumer Price Index,China Producer Price Index,China Retail Sales,FX news,Gold,silver


