Submitted by Marc Chandler, Global Head of Currency Strategy, Brown Brothers Harriman
Fundamental considerations are likely to dominate technical factors in the week ahead. The Federal Reserve, Bank of England and the European Central Bank meet. The PMIs are released. The first estimate of Q2 US GDP, July auto sales and the monthly employment will also be reported. Not to put too fine of a point on it, and recognizing the likelihood of a sub-1% (annualized) US GDP, we expect the news stream to be supportive of the dollar.
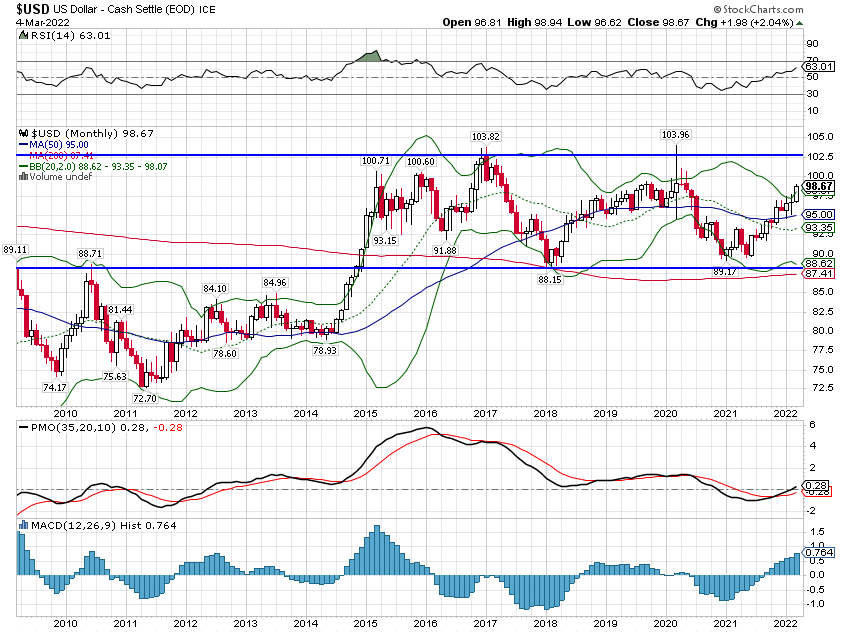
Since July 9, the Dollar Index has fallen about 3.8% to reach a new six week low before the weekend. This was within ticks of the 200-day moving average, which is found near 81.50. Technical indicators, such as the relative strength index and the MACDs, are not extremely oversold, nor are there divergences to a reversal is at hand. A move back above 82.00, and ideally 82.40, would likely confirm a near-term bottom and spur a bottoming of the technical indicators.
The euro managed to push through the Bernanke-induced high set on July 11 just above $1.3200 and raced to $1.33 before running out of steam. After posting a seemingly bullish outside up day on Thursday (July 25), the euro consolidated in less than half a cent range before the weekend.
The euro has approached a downtrend line drawn off the 2011 high near $1.4940, the Feb 2013 high just above $1.3700, and June high a little above $1.34. It is found in the $1.3350-80 area in the period ahead. We are inclined to look for a euro top in this area.
During the euro’s rise in recent week volatility has fallen. At the end of June 3-month implied volatility was near 9.25%. Early last week, it has fallen to six-month lows near 7.60%. We imagine this is about as much as the spring will coil and it is when implied volatility is relatively low that large moves are more common.
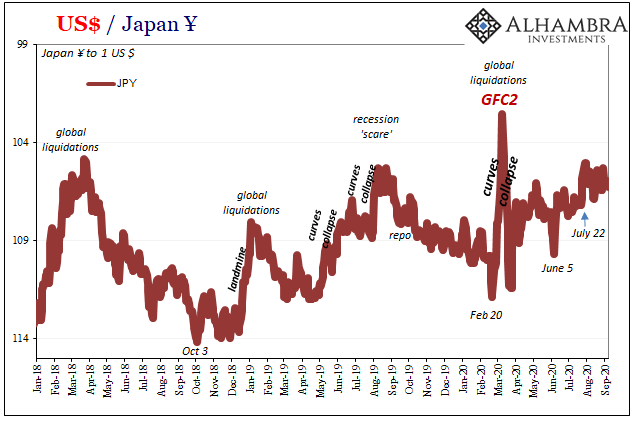
The strength of the yen, the strongest of the major currencies last week, gaining 2.5% against the dollar, may have been the biggest surprise. That there was some profit-taking on short yen positions on news of the government’s success in securing a stable majority in the upper house was not surprising, but the magnitude and persistence of the yen’s strength was.
The dollar posted an outside down day against the yen on Thursday, despite news that Japanese investors bought foreign bonds for the third consecutive week. There was follow through dollar selling on Friday that pushed the greenback through the 100-day moving average (~JPY99.45). The JPY97.65 area corresponds to the 50% retracement of the dollar’s recovery from the early June swoon that peaked near JPY101.50 on July 8.
Separately, we note that the Nikkei gapped below its 20-day moving average before the weekend and settled on its lows. If the gap is not filled early next week it will look increasingly bearish as a break away gap. A break of 14000 could quick see 13500. The JASDAQ, which we have noted, had out-performed the big cap stocks in the first part of the year has generally matched the Nikkei’s performance over the past month, but held up better over the past week. The chart does not look quite as ominous as the Nikkei, but it too gapped lower on Friday.
Sterling, ironically, was the weakest of the major currencies last week, gaining about 0.75% against the greenback, despite news of a 0.6% expansion in Q1. Sterling had been bid through the $1.5280 retracement objective and 100-day moving average early in the week and generally remained above there in subsequent activity. Although there was some intra-day penetration, it did not manage to clove above $1.54.
As we saw with the euro, the technical indicators we look at do not show that a near-term high is in place. However, participants seem reluctant to turn bullish, not only ahead of the BOE meeting (and the potential future guidance), but also the quarterly inflation report in a couple of weeks. The first confirmation that the bears are re-establishing control may be a close of the North American session below the 5-day average (~$1.5360), which it has not done since July 9.
Separately, we note that the FTSE appears to be rolling over after rallying 10.6% off the six-month low set on June 24. Before the weekend, the FTSE made new seven-day lows and the relative strength index and MACDs are also consistent with a near-term top. Initial support is seen near 6500 (20-day average and chart support), but near-term potential may extend toward 6420.
The Australian dollar has been chopping around in a little more than a two cent range in recent weeks. The RBA meets on August 7 in Sydney and the market has moved closer to our view of a 25 bp rate cut. The broad sideways movement over the past month has alleviated the over-sold condition of the market, produced by the 13.5% slide in the two months from mid-April to mid-June. We inclined to sell into upticks toward $0.9300.
The US dollar has ground lower against the Canadian dollar, but is holding the trend line we identified last week that is found by connecting the key upside reversal on May 9 with the June 14 low. It come in near CAD1.0260 before the weekend. The technical indicators are looking stretched. We would use the same
tell, we identified in sterling for Canadian dollar signals. The greenback’s 5-day average has generally contained upticks. It comes in now near CAD1.03. A convincing move above there, say CAD1.0325, would suggest a near-term low is in place and immediate potential extends toward CAD1.0425.
Canadian shares also look vulnerable from a technical perspective. The upper end of this year’s range was approached the middle of last week and, after three tries to get through 12800, the TSX was hit by some profit-taking. The five-day average, which had offered support this month, should not act as resistance. It is found near 12695. A break of 12600 could signal a move toward 12400.
We continue to understand the macro economic and political fundamentals in Mexico to be mostly constructive for the peso. The fact that the peso was unable to gain traction, however, despite pre-weekend news of a ($855 mln) trade surplus in June instead of the ($416 mln) deficit the consensus forecast, warns of technical weakness. The greenback stalled at the 20-day moving average, which is found near MXN12.7475, but the relative strength index and MACDs warn of the risk of additional dollar gains in days ahead. Initially, there is potential toward MXN12.8250, but a move back toward MXN12.95-MXN13.05 is possible, without doing damage to the longer term constructive outlook.
Observations about the speculative positioning in the CME currency futures:
1. Position adjustments were mostly minor. There were four exceptions. The gross long euro position grew 9.9k contracts. Both gross long and short Canadian dollar positions were reduced (9.9k and 13.2k contracts respectively). The gross long peso position increased by 14.7k contracts.
2. The speculative market remains net short all the currency futures tracked here, except the Mexican peso. A month ago, the speculators were also long the euro and Swiss franc.
3. The gross short Australian dollar position is the smallest since mid-May, and at 81.3k contracts, it remains the third largest behind the Japanese yen and euro.
4. The new yen shorts, which have grown by about 25k contracts over the course of July are in weak hands as the dollar has fallen to five week lows in the spot market.
5. The speculative market appears to have used the bounce in sterling to lighten up on longs. The gross short position has been halved in recent weeks to 19.1k contracts, while sterling has recovered six cents in the past three weeks.
6. At 63.1k contracts, the gross long euro position is the largest among the currency futures we track. The last time the euro was trading near current levels, in late June, the gross long position was nearly a quarter larger.
|
|
(spec
position in 000’s of contracts) |
|
|
|
Net |
Prior |
Gross Long |
Change |
Gross Short |
Change |
|
| Euro |
-27.9 |
-37.2 |
63.1 |
9.9 |
91.0 |
0.6 |
|
| Yen |
-87.5 |
-85.8 |
22.5 |
2.3 |
110.0 |
4.0 |
|
| Sterling |
-49.7 |
-37.4 |
19.1 |
-5.5 |
68.8 |
6.7 |
|
| Swiss Franc |
-5.4 |
-5.0 |
6.3 |
-4.4 |
11.8 |
-4.0 |
|
| C$ |
-16.8 |
-20.0 |
22.3 |
-9.9 |
39.0 |
-13.2 |
|
| A$ |
-64.0 |
-70.7 |
17.3 |
-1.9 |
81.3 |
-8.6 |
|
| Mexican Peso |
19.8 |
11.4 |
55.5 |
14.7 |
35.7 |
6.3 |
|
Are you the author?
He has been covering the global capital markets in one fashion or another for more than 30 years, working at economic consulting firms and global investment banks. After 14 years as the global head of currency strategy for Brown Brothers Harriman, Chandler joined Bannockburn Global Forex, as a managing partner and chief markets strategist as of October 1, 2018.
Previous post
See more for 4.) Marc to Market
Next post
Tags:
Canadian Dollar,
Commitments of Traders,
COT,
Currency Positioning,
FX Positioning,
Japanese yen,
Marc Chandler,
MXP,
Net Position,
Peso,
Speculative Positions


