Update 2013:
The Case-Shiller index continued to climb in April 2013; it became clear that this year the "Sell in May" effect is weaker than usually. Solid job figures, especially in services, followed the move of house prices. Comparing the months against the previous year makes it obvious, that the QE3 had only a temporary effect, for the months of November and December. Already the March values of ISM manufacturing PMI (right side above) show that 2013 might be worse than 2012 and even weaker than 2011. It is actually no wonder: U.S. manufacturers deeply depend either on a cheap dollar or on purchases of buyers from the emerging markets. The slowing in emerging markets has now affected also the U.S.
The nineteen fortune-tellers of the FOMC might once again postpone the normalization of monetary policy, perhaps they will "taper" a bit.
Similar as in April 2011, they were speaking in 2013 about a forth-coming policy firming, this time in 2015. For us it seems that in 2015, the United States will still see high structural unemployment, a high number of "out of the labor force", but possibly inflation, this time caused by "core inflation" and not by energy. Given that the Fed and the US state implicitly own a big part of the housing inventory, 2015 seems to be very audacious.
Will they sell the MBS in 2015 again and tell home owners that they must pay 1 or 2 percentage points more for their mortgages or does the market this increase in mortage rates even with the Fed's consent?
The "Sell in May, Come Back in October" Effect
It is the same seasonal anomaly nearly every year: The statistically flawed (see here and here) Non-Farm Payrolls (NFP) report delivers some good winter readings with 150K or 200K new jobs, these years additionally fueled by a weather effect in 2011/2012 and in 2012/2013; biased data that let policy makers to doubt Okun's law. Consequently the stock markets rallied strongly. Decision makers especially of firms in the U.S. and in English-speaking countries get influenced by the NFP coincident indicator and the corresponding Purchasing Manager Indices (PMIs), usually the leading indicators, that increase. [caption id="attachment_2663" align="alignright" width="300"]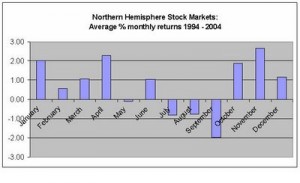 Sell in May, Come back in October[/caption]
Even given these statistical flaws, markets regularly forget that 200K is only a bit above the average 150K new jobs needed to compensate for the population increase and that these 200 K need to be repeated every month over 14 years in order to come back to full employment and to cover the 8.8 million jobs lost in the financial crisis plus the population increase. Only with a significant reduction in the number of unemployed people and those "not in the labor force", will US wages be able to rise more quickly, and only then US consumers will spend as they did before.
Some months later stock markets sell off in their typical "Sell in May" mode, because the 200K NFP reports are not sustainable, in 2012 especially due to the continuing euro crisis and a slowing in Asia.
[caption id="attachment_12947" align="aligncenter" width="400"]
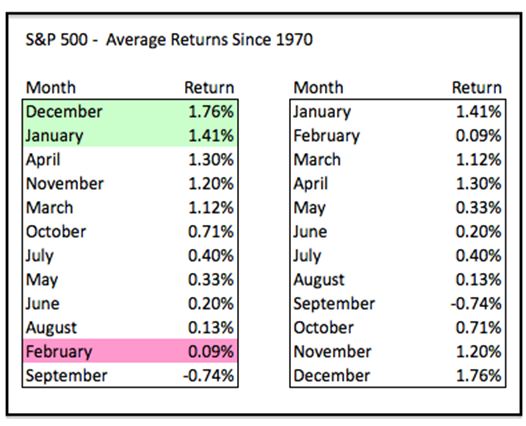 average monthly return between 1970 and 2012 (Source)[/caption]
Stock markets often reflect seasonality in basic economic data.
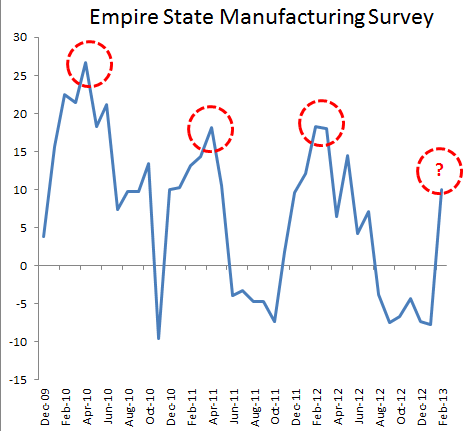 |
| Source NY Fed and Soberlook |
"US house prices seem to be higher – in seasonal terms – in the second and thirdquarter than in the fourth and first quarter of a year. source: Bundesbank study
Reasons for the Sell in May Effect
Studies indicated that the Sell in May Effect is a global phenomenon, and argued that the summer slump may at least partially be driven by a long-standing coordination game.
Our research found out that German, Chinese and Japanese investments are highly export-dependent and tend to increase in Q1 and Q2. This happens in particular after troughs, when US spending has restarted in Q4.
In recent years, stronger Chinese investments let oil and gas prices strongly increase in February (see seasonality of oil prices). This Chinese strength, however did not happen in 2013. One reason for the Chinese weakness was the strong competition caused by the strengthening of Japanese exporters with the weak yen. This might to shift parts of the supply chains of Japanese multi-nationals back to Japan. The second reason was restrictions on the buying of a second home in China.
One important reason is probably the savings rate that traditionally is higher in Q2 than Q1, but also than in Q3. Eurostat reports that the Not Seasonally Adjusted Savings Rate in the euro zone is between 16 and 18% in Q2 but around 12% in Q1. This, however, is not valid for China, Japan or Australia that have other traditions or seasons.
Read about the equivalent for the Swiss National Bank, the "Get Stress in May and Relax in October Effect".
Full story here
Are you the author?
Previous post
See more for
Next post
Tags: Euro crisis,Labor costs,Non-Farm,Okun's Law,PMI,QE3,Quantitative Easing,Safe-haven,seasonal,U.S. ISM Manufacturing PMI,U.S. Nonfarm Payrolls







3 comments
TolerantLiberty
2014-09-05 at 09:28 (UTC 2) Link to this comment
test
TolerantLiberty
2014-09-05 at 09:28 (UTC 2) Link to this comment
Let’s have a closer look at the supply side:
There are some slight effects from U.S. shale oil industry and – yes, the Fed’s
years-long dollar bashing has had nice effect: With the weak dollar, American
labor is relatively cheap on a global scale – or better it was. On the other
side American companies benefited from the dollar’s reserve currency status and
less problems obtaining credit. Still, many prefered to invest abroad, seek
cheap labor and suppliers abroad and to globalize their supply chains. While in
the U.S. those were mostly the bigger companies in the S&P 500, in Germany
or Switzerland even the medium enterprises followed that strategy.
or Switzerland even the medium enterprises followed that strategy.
Logically
the S&P500 clearly outperformed smaller U.S. companies; the small business
confidence is far under the values seen before the crisis.
http://www.advisorperspectives.com/dshort/updates/NFIB-Small-Business-Optimism-Index.php
TolerantLiberty
2014-09-05 at 09:48 (UTC 2) Link to this comment
On
the demand side, however, we see the following
1) Incited by high interest rates – EM prefer to save and not to spend, while austerity
and the desire to save on your own for the soon coming retirement age instead
of relying on perceived “near-bankrupt governments” depressed
investments in these countries and consequently oil and commodity prices.
2) Due to lower taxes and higher distances , gasoline
takes a significantly higher part in the US basket than in European spending.
Lower gas prices, however, help to spend on things that are no so essential,
like for example the typical American car that – as opposed – to European ones still
needs more fuel.