George Dorgan
My articles My siteAbout meMy videosMy books
Follow on:LinkedINTwitterSeeking Alpha
CFA SocietyEconomicBlogs
Update May 05, 2026:
The sight deposits at the SNB increased by 3.8 billion francs compared to the previous week.
Since one year we see the inflation scenario I was speaking about before.
During high inflation periods both the Swiss franc and gold must go up.
After the recent monetary assessment, it has become clear that the SNB does not accept higher inflation.
One part is imported inflation, it can be reduced having a stronger currency.
Update May 19, 2022
Interestingly sight deposits are rising quite strongly, capital is flowing into Swiss francs between April 22 until May 17, when the Walmart results were published.
The price action, however, was different and mostly driven by FX speculators.
The ECB has started speaking about rate hikes and therefore speculators were selling CHF.
Despite rising inflation in Switzerland, the SNB has decided to enforce this CHF devaluation with renewed interventions.
From history (Summer 2011), we know how this ends: The SNB might hike rates.
| Week ending in (+ link to source) | Events…………….. | avg. EUR/CHF during period | avg. USD/CHF during period | Net Speculative Position CHF vs USD |
Net speculative Position EUR vs USD |
Delta sight deposits if >0 then SNB intervention |
Total Sight Deposits | Sight Deposits @SNB from Swiss banks | “Other Sight Deposits” @SNB (other than Swiss banks) |
|---|---|---|---|---|---|---|---|---|---|
| 0.9204 | 0.7858 | -35.2k | +35.7k | +3.8 bn. per week | 459.7 bn. | 430.7 bn. | 29.0 bn. | ||
| 0.9184 | 0.7831 | -33.3k | +41.3k | +2.3 bn. per week | 455.9 bn. | 433.0 bn. | 22.9 bn. | ||
| 0.9217 | 0.7824 | -34.1k | +26.0k | -7.6 bn. per week | 453.6 bn. | 433.3 bn. | 20.3 bn. | ||
| 0.9238 | 0.7934 | -30.7k | -7.5k | -3.1 bn. per week | 461.2 bn. | 437.5 bn. | 23.7 bn. | ||
| 0.9210 | 0.7986 | -29.9k | +0.5k | +3.4 bn. per week | 464.3 bn. | 429.9 bn. | 34.4 bn. |
Rising Interest Rates:
There are some periods when the Fed and the ECB are about to raise rates, then CHF might fall for some time.
Given that there are no positive real interest rates any more, these periods are usually short-lived.
The War in Ukraine
The war in Ukraine and its consequence stronger oil prices has both indicators for a stronger CHF
- CHF as safe haven
- CHF as inflation hedge
Inflation Hedge vs. Safe Haven
Beware that CHF is more an inflation hedge than a safe haven. The Japanese Yen and often the euro rise during stock bear markets. The reason the rising euro is that stocks are denominated rather in USD when comparing the liquidity of the EUR, CHF, JPY and USD.
The Ukraine war, however, also means a reshuffling of other assets like bonds into USD and out of the Euro.
Sight Deposits versus Speculative Position
The following table shows the recent developments of:
- Sight Deposits, i.e. SNB interventions
- Speculative positions CHF: Since April 2020, speculators are long CHF against USD; the number is positive.
- FX rates (inside the graph)
Sight Deposits versus EUR/CHFThe following graph shows the last week’s change in sight deposits compared with the EUR/CHF exchange rate since the height of the Corona crisis. High sight deposits is the equivalent of big SNB interventions. The SNB typically intervenes, when the EUR is weak against CHF. Clicking inside the graph, the reader can see the FX prices. We see the lowest price for a euro at 1.0521 and 1.0568 in March 2020 and April 2020, actually when the sight deposits were highest. |
|
Speculative PositionsThe second driver of a strong CHF is the speculative position (against USD). A higher long CHF speculative position typically means that USD/CHF gets weaker. |
|
Sight Deposits between 2014 and April 2020The graph shows the development of sight deposits between 2014 and 2018:
|
SNB Sight Deposits vs. EUR/CHF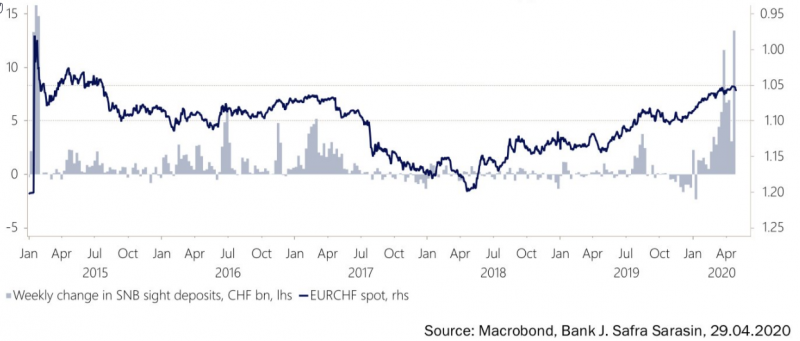 - Click to enlarge |
Frequently Asked QuestionsWhat are sight deposits? They are the equivalent of cash on Swiss bank accounts, when these banks have nothing else to do with this money than giving it to the central bank in the form of "sight deposits of banks". |
 |
| wzemet | |
A: Why is SNB buying FX positions?The SNB buys FX positions, because she considers CHF to be too strong. Hence it would harm in particular the Swiss exports and the jobs in the export industry. |
A: Why is SNB selling FX positions?To sell FX position is not a deliberate decision, but purely based on the SNB funding situation, as visible in the balance sheet above. In short: The SNB is forced to sell When banks remove funding on the liabilities side of the balance sheet - most the so-called "sight deposits" - then the SNB is forced to sell FX positions on the assets side. |
B: Why are banks removing funds from the SNB?Typically banks move the funds to the central bank, when they do not have nothing better to do with, e.g. (1) lending it to companies or private investors at a (positive) interest rate with sufficiently low risk - or Ad (2) Due to regulatory restrictions, banks or insurances cannot easily invest their assets into foreign currency - other from their reporting currency. Hence (2) is mostly driven by hedge funds or speculators, which are not contained in the sight deposits. When banks do not find the demand for loans, then they must deposit the funds at the central bank. There is no other way - apart from keeping the assets as cash. |
|
C: Sight deposits are assets for the banks, but liabilities for the central bank.What we explained for the central bank, is also valid for the banks: When foreigners decide to deposits funds on a Swiss bank, then the right side of the bank's balance sheet rises and so will the left side, the assets. Again when the bank has nothing better to do with these assets, it must (sight) deposit at the central bank, at the SNB. |
D: When does this vicious cycle end?The "vicious" circle for the central bank, is that it is buying more and more foreign FX. This cycle is only broken when foreigners decide to stop buying assets (e.g. cash, stocks, bonds, houses) denominated in Swiss francs. This happens typically when they think that the assets in Swiss Franc are losing too much value. CHF cash might lose value due to FX speculators (see below) But rising CHF stocks or rising Swiss house prices might counter the falling currency, so that it is still worth buying Swiss assets. Terms of balance of payments Finally we will have to look at the balance of payments. The Swiss current account surplus must be smaller than outflows in the financial account. |
Detailed Explanations
FX Rates, Balance of Payments and Capital Flows
At the very basis you should understand that FX rates are driven by the balance of payments for this currency, i.e. by inflows of capital or by not existing capital outflows when the country has a current account surplus. These non-existent outflows are very important for Switzerland, a country with a big trade and current account surplus. Capital inflows (or non-existent outflows) can be invested in different types of assets like real estate, stocks, bonds, physical cash or in cash on bank accounts.FX interventions
When investors do not want to buy enough foreign assets for a given (potentially manipulated FX rate), then the central bank might do this instead. This is what we call FX interventions. They are financed with local currency, with the excessive capital inflows or "non existent outflows". Very often the central bank considers the cash on bank accounts as "excessive".
As opposed to the Bank of Japan, for example, the SNB buys assets denominated in foreign currency.
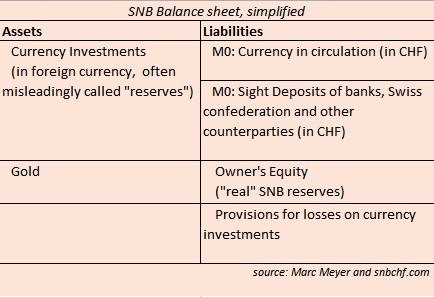
Sight deposits
are the equivalent of cash on Swiss bank accounts, when these banks have nothing else to do with this money than giving it to the central bank in the form of "sight deposits of banks".
They are currently the by far most important means of financing for SNB currency purchases, for interventions. Sight deposits are assets for commercial banks, the Swiss confederation and other counterparties that deposit money at the SNB, but for the SNB they are liabilities, debt.
Sight deposits are always denominated in CHF. The SNB finances itself with Swiss Francs, while its assets are nearly all in foreign currency. When CHF appreciates, then the debt increases more than the assets. The assets lose their value. As consequence the central bank may lose its Owner's Equity which may result in a central bank bankruptcy or a recapitalization by the Swiss state.
The IMF-compliant weekly monetary data release on the SNB website provides the recent developments in sight deposits. With this weekly delivery it gives an far earlier indication of SNB interventions than the relatively late releases of balance sheet or IMF data.
Currency in Circulation
Currency in the form of bank notes and coins is the second financing method, it represents the "traditional money printing" of central bank debt with the printing press. Nowadays this printing of debt in the form of bank notes is far less important than the electronic printing of SNB debt called "sight deposits".
Money Printing
is the popular word for unsterilised central bank interventions that - at least for monetarists - paves the way for price inflation. In the following we concentrate on sight deposits as means of money printing, because currency in circulation changes far less than sight deposits. From October 2014 to October 2015, the SNB printed new bank notes of a total of 6 billion CHF but electronic money (sight deposits) rose by 100 billion francs (see the SNB balance sheet).
Sight Deposits of Swiss Banks and Other Sight Deposits
Sight Deposits of Swiss banks
They are part of M0, the monetary base: With the money multiplier effect, money on Swiss banks have a higher influence on Swiss lending and inflation. Therefore the two categories are separated. For monetarists, a big rise in Swiss sight deposits would be a bigger issue than the increase of the second item, which is:
"Other Sight Deposits"
are the ones of other counter-parties with an account at the SNB. These include loans from the Swiss confederation and federal authorities like the state pension fund (In German "AHV"). Other counter parties are insurances, private pension funds, settlement agencies, foreign banks, investment companies, hedge funds and foreign central banks and institutions. These other sight deposits are not part of M0, because they are not able to "multiple money" with loans to the public (no money multiplier effect).
Negative Rates on Sight Deposits
Since December 2014, sight deposits above the threshold of around 320 bn. are "punished" with negative rates (20 times more than the minimum reserves, visible in "compliance in %" on the monetary data). The punishment fee is currently 0.75%. Hence by End of November 2015, around 148 bn. CHF are concerned by the negative rates, while the 320 bn. are "exempted". Between November 2015 and April 2016, sight deposits increased by 22 bn. . Since the exemption level did not increase, all these 22 bn should be punished by 0.75%. The SNB achieved a profit of 333 million on negative rates only in Q1/2016.
The relationship between CFTC speculative position and sight deposits
Example: The data graph shows that real money went long 13.1 billion CHF during the week of Jan 15, 2015, but FX speculators were short CHF by 26444 x 125K contracts. Speculators got ripped off by real money. It is also visible that only in November 2014, the SNB started to intervene: delta sight deposits remained at zero before.
Detailed Table
This is the detailed table that shows how the SNB increased its debt and accumulated FX investments - and
how it sold FX positions since Summer 2017.
The terms are explained in the sections above.
Weekly SNB Intervention Watch: Sight Deposits
| Date (+ link to source) | avg. EUR/CHF during period | avg. USD/CHF during period | avg. EUR/USD during period | Events | Net Speculative CFTC Position CHF against USD | Delta sight deposits if >0 then SNB intervention | Total Sight Deposits | Sight Deposits @SNB from Swiss banks | "Other Sight Deposits" @SNB (other than Swiss banks) |
|---|---|---|---|---|---|---|---|---|---|
| 01 May 2026 | 0.9204 | 0.7858 | 1.1713 | -35.2k | +3.8 bn. per week | 459.7 bn. | 430.7 bn. | 29.0 bn. | |
| End April 2026 | 0.9184 | 0.7831 | 1.1729 | -33.3k | -5.0 bn. per month | 455.9 bn. | 433.0 bn. | 22.9 bn. | |
| End March 2026 | 0.9160 | 0.7922 | 1.1564 | -27.1k | +1.1 bn. per month | 460.9 bn. | 433.1 bn. | 27.8 bn. | |
| End February 2026 | 0.9117 | 0.7729 | 1.1796 | -41.2k | +7.1 bn. per month | 459.8 bn. | 440.5 bn. | 19.3 bn. | |
| End January 2026 | 0.9179 | 0.7688 | 1.1939 | -42.9k | -5.6 bn. per month | 452.7 bn. | 436.6 bn. | 16.1 bn. | |
| End December 2025 | 0.9293 | 0.7891 | 1.1734 | -44.0k | -0.2 bn. per month | 458.3 bn. | 439.6 bn. | 18.7 bn. | |
| End November 2025 | 0.9328 | 0.8059 | 1.1576 | -27.8k | -12 bn. per month | 458.5 bn. | 437.3 bn. | 21.2 bn. | |
| End October 2025 | 0.9239 | 0.7952 | 1.1619 | -23.0k | -4.2 bn. per month | 470.5 bn. | 446.9 bn. | 23.6 bn. | |
| End September 2025 | 0.9341 | 0.7953 | 1.1745 | -23.0k | +2.4 bn. per month | 474.7 bn. | 446.6 bn. | 28.1 bn. | |
| End August 2025 | 0.9355 | 0.8028 | 1.1654 | -27.0k | -2.4 bn. per month | 472.3 bn. | 444.6 bn. | 27.7 bn. | |
| End July 2025 | 0.9331 | 0.7947 | 1.1744 | -26.1k | +14.0 bn. per month | 474.7 bn. | 444.9 bn. | 29.8 bn. | |
| End June 2025 | 0.9375 | 0.8045 | 1.1654 | -20.9k | +15.8 bn. per month | 460.7 bn. | 425.8 bn. | 34.9 bn. | |
| End May 2025 | 0.9352 | 0.8243 | 1.1346 | -25.5k | -6.2 bn. per month | 444.9 bn. | 434.8 bn. | 10.6 bn. | |
| End April 2025 | 0.9380 | 0.8228 | 1.1400 | -25.5k | -0.1 bn. per month | 451.1 bn. | 442.6 bn. | 8.5 bn. | |
| End March 2025 | 0.9521 | 0.8821 | 1.0786 | -34.4k | +13.8 bn. per month | 451.2 bn. | 441.7 bn. | 9.5 bn. | |
| End February 2025 | 0.9375 | 0.8974 | 1.0447 | -39.5k | -4.4 bn. per month | 437.4 bn. | 429.4 bn. | 8.0 bn. | |
| End January 2025 | 0.9444 | 0.9064 | 1.0418 | -43.0k | -3.9 bn. per month | 441.8 bn. | 432.9 bn. | 8.9 bn. | |
| End December 2024 | 0.9366 | 0.8996 | 1.0411 | -28.4k | -13.2 bn. per month | 445.7 bn. | 436.4 bn. | 9.2 bn. | |
| End November 2024 | 0.9307 | 0.8835 | 1.0534 | -39.7k | +1.5 bn. per month | 458.9 bn. | 450.9 bn. | 8.0 bn. | |
| End October 2024 | 0.9355 | 0.8660 | 1.0803 | -32.7k | -14.8 bn. per month | 457.4 bn. | 449.4 bn. | 8.0 bn. | |
| End September 2024 | 0.9430 | 0.8456 | 1.1153 | -19.3k | +15.5 bn. per month | 472.2 bn. | 463.6 bn. | 8.6 bn. | |
| End August 2024 | 0.9401 | 0.8456 | 1.1118 | -24.6k | -1.5 bn. per month | 456.7 bn. | 448.6 bn. | 8.1 bn. | |
| End July 2024 | 0.9620 | 0.8861 | 1.0856 | -42.2k | +6.2 bn. per month | 458.2 bn. | 449.5 bn. | 8.7 bn. | |
| End June 2024 | 0.9598 | 0.8963 | 1.0708 | -35.1k | -10.0 bn. per month | 452.0 bn. | 443.0 bn. | 9.0 bn. | |
| End May 2024 | 0.9848 | 0.9089 | 1.0837 | -44.4k | -13.7 bn. per month | 462.0 bn. | 452.4 bn. | 9.6 bn. | |
| End April 2024 | 0.9762 | 0.9129 | 1.0694 | -42.6k | +18.9 bn. per month | 475.7 bn. | 467.3 bn. | 8.4 bn. | |
| End March 2024 | 0.9755 | 0.9020 | 1.0814 | -22.0k | -23.7 bn. per month | 456.8 bn. | 448.1 bn. | 8.7 bn. | |
| End February 2024 | 0.9523 | 0.8810 | 1.0809 | -9.9k | +17.6 bn. per 2 months | 480.5 bn. | 471.4 bn. | 9.1 bn. | |
| End December 2023 | 0.9367 | 0.8477 | 1.1049 | -3.4k | -13.4 bn. per 3 months | 462.9 bn. | 453.2 bn. | 9.7 bn. | |
| End September 2023 | 0.9667 | 0.9156 | 1.0558 | -9.1k | -15.5 bn. per 3 months | 476.3 bn. | 466.1 bn. | 10.2 bn. | |
| End June 2023 | 0.9776 | 0.8961 | 1.0910 | -4.9k | -32.1 bn. per 2 months | 491.8 bn. | 480.2 bn. | 11.6 bn. | |
| End April 2023 | 0.9826 | 0.8917 | 1.1020 | -3.7k | -39.7 bn. per month | 523.9 bn. | 506.5 bn. | 17.4 bn. | |
| End March 2023 | 0.9969 | 0.9390 | 1.0615 | -6.4k | +42.9 bn. per month | 563.6 bn. | 528.8 bn. | 34.8 bn. | |
| End February 2023 | 0.9894 | 0.9233 | 1.0715 | -9.5k | -7.3 bn. per month | 520.7 bn. | 506.0 bn. | 14.7 bn. | |
| End January 2023 | 1.0018 | 0.9206 | 1.0885 | -9.5k | -11.2 bn. per month | 528.0 bn. | 511.6 bn. | 16.4 bn. | |
| End December 2022 | 0.9876 | 0.9273 | 1.0649 | -4.1k | -16.2 bn. per month | 539.2 bn. | 491.9 bn. | 47.3 bn. | |
| End November 2022 | 0.9817 | 0.9480 | 1.0357 | -14.5k | -26.2 bn. per month | 555.4 bn. | 523.0 bn. | 32.4 bn. | |
| End October 2022 | 0.9904 | 0.9936 | 0.9968 | -11.3k | -88.0 bn. per month | 581.6 bn. | 539.6 bn. | 42.0 bn. | |
| End September 2022 | 0.9559 | 0.9846 | 0.9709 | -5.7k | -83.1 bn. per month | 669.6 bn. | 563.7 bn. | 105.9 bn. | |
| End August 2022 | 0.9612 | 0.9649 | 0.9962 | -2.4k | +5.6 bn. per month | 752.7 bn. | 643.6 bn. | 109.1 bn. | |
| End July 2022 | 0.9767 | 0.9586 | 1.0190 | -11.3k | -1.3 bn. per month | 747.1 bn. | 635.3 bn. | 111.8 bn. | |
| End June 2022 | 1.0143 | 0.9628 | 1.0536 | SNB Now Selling FX | -7.2k | -5.6 bn. per month | 748.4 bn. | 653.5 bn. | 94.9 bn. |
| End May 2022 | 1.0290 | 0.9608 | 1.0711 | Falling CHF despite capital flowing into CHF | -19.7k | +11.4 bn. per month | 754.0 bn. | 663.0 bn. | 91.0 bn. |
| End April 2022 | 1.0279 | 0.9509 | 1.0809 | -11.4k | +11.2 bn. per month | 742.6 bn. | 667.6 bn. | 75.0 bn. | |
| End March 2022 | 1.0249 | 0.9315 | 1.1004 | -8.4k | +6.6 bn. per month | 731.4 bn. | 658.5 bn. | 72.9 bn. | |
| End January 2022 | 1.0378 | 0.9148 | 1.1345 | -10.8k | +2.1 bn. per month | 724.8 bn. | 657.4 bn. | 67.4 bn. | |
| End December 2021 | 1.0408 | 0.9228 | 1.1278 | -8.3k | +3.4 bn. per month | 722.7 bn. | 645.7 bn. | 77.0 bn. | |
| End November 2021 | 1.0510 | 0.9274 | 1.1333 | -8.9k | +2.2 bn. per month | 719.3 bn. | 646.7 bn. | 72.6 bn. | |
| End October 2021 | 1.0646 | 0.9170 | 1.1609 | -19.4k | +2.6 bn. per month | 717.1 bn. | 645.3 bn. | 71.8 bn. | |
| End September 2021 | 1.0840 | 0.9250 | 1.1717 | -9.2k | -0.1 bn. per month | 714.5 bn. | 636.0 bn. | 78.5 bn. | |
| End August 2021 | 1.0811 | 0.9207 | 1.1742 | +9.7k | +2.7 bn. per month | 714.6 bn. | 639.3 bn. | 75.3 bn. | |
| End July 2021 | 1.0780 | 0.9103 | 1.1842 | +8.5k | -0.6 bn. per month | 711.9 bn. | 636.4 bn. | 75.5 bn. | |
| End June 2021 | 1.0948 | 0.9177 | 1.1930 | +13.6k | +2.0 bn. per month | 712.5 bn. | 631.0 bn. | 81.5 bn. | |
| End May 2021 | 1.0954 | 0.8973 | 1.2207 | -1.2k | +9.1 bn. per month | 710.5 bn. | 634.6 bn. | 75.9 bn. | |
| End April 2021 | 1.1018 | 0.9117 | 1.2086 | -0.7k | -1.2 bn. per month | 701.4 bn. | 634.0 bn. | 67.4 bn. | |
| End March 2021 | 1.1053 | 0.9342 | 1.1830 | +2.9k | -1.5 bn. per month | 702.6 bn. | 630.0 bn. | 72.6 bn. | |
| End February 2021 | 1.0977 | 0.9040 | 1.2143 | +11.5k | -0.5 bn. per month | 704.1 bn. | 640.8 bn. | 63.3 bn. | |
| End January 2021 | 1.0780 | 0.8885 | 1.2132 | +10.1k | +0.7 bn. per month | 704.6 bn. | 637.4 bn. | 67.2 bn. | |
| End December 2020 | 1.0835 | 0.8885 | 1.2196 | +14.7k | -2.6 bn. per month | 703.9 bn. | 632.3 bn. | 71.6 bn. | |
| End November 2020 | 1.0812 | 0.9084 | 1.1903 | +15.0k | -1.1 bn. per month | 706.5 bn. | 644.4 bn. | 62.1 bn. | |
| End October 2020 | 1.0697 | 0.9116 | 1.1734 | +15.5k | +3.1 bn. per month | 707.6 bn. | 636.1 bn. | 71.5 bn. | |
| End September 2020 | 1.0782 | 0.9225 | 1.1687 | +15.9k | +2.9 bn. per month | 704.5 bn. | 634.2 bn. | 70.3 bn. | |
| End August 2020 | 1.0745 | 0.9080 | 1.1835 | +11.9k | +7.9 bn. per month | 701.6 bn. | 636.5 bn. | 65.1 bn. | |
| End July 2020 | 1.0769 | 0.9144 | 1.1777 | +8.4k | +10.7 bn. per month | 693.7 bn. | 625.5 bn. | 68.2 bn. | |
| End June 2020 | 1.0659 | 0.9474 | 1.1251 | After SNB | +1.4k | +1.4 bn. per month | 683.0 bn. | 602.5 bn. | 80.5 bn. |
| End May 2020 | 1.0642 | 0.9664 | 1.1013 | Corona Recovery Rally | +8.7k | +31.0 bn. per month | 681.6 bn. | 597.8 bn. | 83.8 bn. |
| End April 2020 | 1.0521 | 0.9702 | 1.0829 | Reopening in bigger parts of Europe | +4.9k | +30.1 bn. per month | 650.6 bn. | 573.9 bn. | 76.7 bn. |
| End March 2020 | 1.0602 | 0.9716 | 1.0913 | Corona panic | +4.9k | +24.8 bn. per month | 620.5 bn. | 529.0 bn. | 91.5 bn. |
| End February 2020 | 1.0633 | 0.9730 | 1.0928 | +0.6k | +7.0 bn. per month | 595.7 bn. | 502.2 bn. | 93.5 bn. | |
| End January 2020 | 1.0698 | 0.9697 | 1.1044 | +3.5k | +4.1 bn. per month | 588.7 bn. | 503.7 bn. | 85.0 bn. | |
| End December 2019 | 1.0884 | 0.9821 | 1.1108 | -20.9k | -5.2 bn. per month | 584.6 bn. | 499.0 bn. | 85.6 bn. | |
| End November 2019 | 1.0993 | 0.9931 | 1.1012 | -21.0k | -2.9 bn. per month | 589.4 bn. | 504.2 bn. | 85.2 bn. | |
| End October 2019 | 1.1013 | 0.9927 | 1.1118 | -11.3k | +0.1 bn. per month | 592.3 bn. | 487.9 bn. | 104.4 bn. | |
| End September 2019 | 1.0857 | 0.9907 | 1.0963 | -10.6k | +0.6 bn. per month | 592.2 bn. | 477.9 bn. | 114.3 bn. | |
| End August 2019 | 1.0883 | 0.9788 | 1.1052 | -3.8k | +10.4 bn. per month | 591.6 bn. | 475.6 bn. | 116.0 bn. | |
| End July 2019 | 1.1021 | 0.9879 | 1.1151 | -13.2k | +1.9 bn. per month | 581.2 bn. | 477.1 bn. | 104.1 bn. | |
| End June 2019 | 1.1103 | 0.9878 | 1.1372 | -16.5k | +1.1 bn. per month | 579.3 bn. | 466.7 bn. | 112.6 bn. | |
| End May 2019 | 1.1214 | 1.0105 | 1.1161 | -34.7k | +1.5 bn. per month | 578.2 bn. | 474.3 bn. | 103.9 bn. | |
| End April 2019 | 1.1394 | 1.0089 | 1.1178 | -37.5k | +0.6 bn. per month | 576.7 bn. | 479.8 bn. | 96.9 bn. | |
| End March 2019 | 1.1189 | 1.0001 | 1.1248 | -27.3k | -0.4 bn. per month | 576.1 bn. | 488.5 bn. | 87.6 bn. | |
| End February 2019 | 1.1350 | 1.0015 | 1.1335 | -18.1k | -0.2 bn. per month | 576.5 bn. | 493.6 bn. | 82.9 bn. | |
| End January 2019 | 1.1319 | 0.9895 | 1.1373 | -22.9k | +2.5 bn. per month | 576.7 bn. | 481.7 bn. | 95.0 bn. | |
| End December 2018 | 1.1262 | 0.9920 | 1.1397 | -22.9k | -2.7 bn. per month | 574.2 bn. | 479.0 bn. | 95.2 bn. | |
| End November 2018 | 1.1310 | 1.0008 | 1.1339 | -21.0k | -1.1 bn. per month | 576.9 bn. | 472.0 bn. | 104.9 bn. | |
| End October 2018 | 1.1387 | 1.1418 | -17.1k | +0.1 bn. per month | 578.0 bn. | 470.0 bn. | 108.0 bn. | ||
| End September 2018 | 1.1368 | 1.1686 | -16.0k | +1.7 bn. per month | 577.9 bn. | 474.8 bn. | 103.1 bn. | ||
| End August 2018 | 1.1337 | 1.1658 | -44.7k | -0.2 bn. per month | 576.2 bn. | 477.8 bn. | 98.4 bn. | ||
| End July 2018 | 1.1602 | 1.1678 | -45.8k | 0 | 576.4 bn. | 476.5 bn. | 99.9 bn. | ||
| End June 2018 | 1.1549 | 1.1640 | -38.0k | -0.2 bn. per month | 576.4 bn. | 469.3 bn. | 107.1 bn. | ||
| End May 2018 | 1.1640 | 1.1725 | -37.3k | +1.6 bn. per month | 576.6 bn. | 466.3 bn. | 110.3 bn. | ||
| End April 2018 | 1.1968 | 1.2160 | -10.2k | -0.3 bn. per month | 575.1 bn. | 471.1 bn. | 104.0 bn. | ||
| End March 2018 | 1.1762 | 1.2356 | -9.4k | -0.6 bn. per month | 575.4 bn. | 469.2 bn. | 106.2 bn. | ||
| End February 2018 | 1.1526 | 1.2331 | -15788X125K | +1.0 bn. per month | 576 bn. | 460.2 bn. | 115.8 bn. | ||
| End January 2018 | 1.1695 | 1.2370 | -22115X125K | +1.8 bn. per month | 575 bn. | 465.1 bn. | 109.9 bn. | ||
| End December 2017 | 1.1713 | 1.1911 | -13902X125K | -4.2 bn. per month | 573.2 bn. | 473.4 bn. | 99.8 bn. | ||
| End November 2017 | 1.1645 | 1.1815 | -27983X125K | -1.1 bn. per month | 577.4 bn. | 477.9 bn. | 99.6 bn. | ||
| End October 2017 | 1.1618 | 1.1698 | -11597X125K | -0.5 bn. per month | 578.5 bn. | 469.4 bn. | 109.1 bn. | ||
| End September 2017 | 1.1434 | 1.1799 | -1862X125K | -0.2 bn. per month | 579.0 bn. | 473.0 bn. | 106.0 bn. | ||
| End August 2017 | 1.1438 | 1.1921 | -1778X125K | +0.1 bn. per month | 579.2 bn. | 468.5 bn. | 110.7 bn. | ||
| End July 2017 | 1.1184 | 1.1691 | -1550X125K | +0.5 bn. per month | 579.1 bn. | 478.9 bn. | 100.2 bn. | ||
| End June 2017 | 1.0913 | 1.1353 | -4669X125K | +2.6 bn.per month | 578.6 bn. | 490.0 bn. | 88.6 bn. | ||
| End May 2017 | 1.0912 | 1.1202 | -19785X125K | +4.5 bn. per month | 576 bn. | 489.3 bn. | 86.7 bn. | ||
| End April 2017 | 1.0832 | 1.0895 | -17317X125K | +9.8 bn. per month | 571.5 bn. | 479.5 bn. | 92.0 bn. | ||
| End March 2017 | 1.0709 | 1.0754 | Eurozone core inflation only at 0.7% | -16392X125K | +13.5 bn. per month | 561.7 bn. | 475.1 bn. | 86.6 bn. | |
| End February 2017 | 1.0648 | 1.0570 | New record in Swiss trade surplus | -8936X126K | +15.4 bn. per month | 548.2 bn. | 470.2 bn. | 78.0 bn. | |
| End January 2017 | 1.0718 | 1.0725 | US Q4 GDP only +1.9% | -13644X125K | +3.8 bn. per month | 532.8 bn. | 466.7 bn. | 66.1 bn. | |
| End December 2016 | 1.0728 | 1.0467 | -10091X125K | +1.5 bn. per month | 529.0 bn. | 466.3 bn. | 62.7 bn. | ||
| End November 2016 | 1.0749 | 1.0786 | Election of Donald Trump, Renzi loses referendum in Italy | -24334X125K | +9 bn. per month | 527.5 bn. | 457.6 bn. | 69.9 bn. | |
| End October 2016 | 1.0839 | 1.0920 | Strong US GDP Release | -18700x125K | +1.1 bn. per month | 518.5 bn. | 451.9 bn. | 66.6 bn. | |
| End September 2016 | 1.0891 | 1.1230 | SNB intervenes at end Q3. Speculator follow. | -5956x125K | +1.6 bn. per month | 517.4 bn. | 452.9 bn. | 64.5 bn. | |
| End August 2016 | 1.0961 | 1.1169 | Not convincing U.S. jobs numbers, that may delay a Fed rate hike. | +8208x125K | +4.4 bn. per month | 515.8 bn. | 438.7 bn. | 77.0 bn. | |
| End July 2016 | 1.0868 | 1.1058 | US Q2 GDP only +1.2% | +946x125K | +3.9 bn per month | 511.4 bn | 435.0 bn | 76.4 bn | |
| End June 2016 | 1.0880 | 1.13 | Brexit: Interventions for 10.8 bn CHF | +10867x125K | +13.4 bn per month | 507.5 bn | 430.3 bn | 77.2 bn | |
| End May 2016 | 1.1065 | 1.1365 | Reduction in CHF long, smaller SNB interventions | +3954x125K | +2.9 bn per month | 494.1 bn | 420.7 bn | 73.4 bn | |
| End April 2016 | 1.0934 | 1.1340 | Long CHF vs. USD still increasing, SNB intervening at high levels | +9410x125K | +7.5 bn per month | 491.2 bn | 423.9 bn | 67.3 bn | |
| End March 2016 | 1.0929 | 1.1142 | Speculators shift to CHF long after Fed reduced rate expectations | +4967x125K | +6.1 bn per month | 483.7 bn | 420.2 bn | 63.5 bn | |
| End February 2016 | 1.1013 | 1.1105 | SNB interventions for 5.1 bn CHF | -2321x125K | +5.1 bn per month | 477.6 bn | 418.0 bn | 59.6 bn | |
| End January 2016 | 1.0942 | 1.0866 | Some distortion in sight deposits with the End December "tax effect". | -4506x125K (Short CHF) | +4.8 bn per month | 472.7 bn | 403.1 bn | 69.2 bn | |
| End December 2015 | 1.0828 | 1.0900 | With "dovish" Fed hike, short CHF pos. evaporates, SNB selling | +3564x125K | - 0.5 bn per month | 467.9 bn | 403.8 bn | 64.1 bn | |
| End November 2015 | 1.0840 | 1.0735 | Speculation about lower Swiss neg. rates: high spec. pos. against CHF | -15329x125K | +1 bn per month | 468.4 bn | 401.7 bn | 66.7 bn | |
| End October 2015 | 1.0857 | 1.1004 | Draghi threads with more QE, SNB with lower neg. rates | +1499x125k | +2.1 bn per month | 467.4 bn | 401.3 bn | 66.1 bn | |
| End September 2015 | 1.0922 | 1.1237 | Greek elections and Volkswagen neg. for Euro | -2715x125k | +1.4 bn per month | 465.3 bn | 399.1 bn | 66.1 bn | |
| End August 2015 | 1.08 | 1.1250 | China crisis negative for CHF and pos. for USD (see more) | -12597x125k (CHF short) | +3 bn per month | 463.9 bn | 396.0 bn | 67.9 bn | |
| July 17, 2015 | 1.0426 | 1.0904 | Deal with Greece achieved | +3100x125k (CHF long) | +0.8 bn each week | 460.9 bn | 396.8 bn | 64 bn | |
| End June 2015 | 1.0400 | 1.1100 | Greek Referendum | +6900x125k | +3.4 bn per month | 457.9 bn | 391.1 bn | 66.7 bn | |
| End May 2015 | 1.0405 | 1.1160 | Ascent of EUR/USD with rising German inflation | +8300x125k | +5.5 bn per month | 454.5 bn | 380.5 bn | 73.5 bn | |
| End April 2015 | 1.03 | 1.09 | Weak US GDP let Euro and CHF rise. | +1300x125k | +6 bn per month | 449 bn | 384 bn | 65 bn | |
| End March 2015 | 1.0602 | 1.0831 | Euro falls thanks to Greek and Draghi fool game (GR= 1.5% of EU GDP) | +706x125k | 0 | 443 bn | 379.3 bn | 64 bn | |
| End February 2015 | 1.0617 | 1.1353 | Greeks continue fooling Germany | -5085x125k (CHF short) | 0 | 443 bn | 383.6 bn | 59.7 bn | |
| January 30, 2015 | 1.04 | 1.1340 | Greek crisis again: Run to safety continues | -7373x125k | +14.8 bn per week | 443 bn | 383.3 bn | 59.7 bn | |
| January 23, 2015 | 0.99 | 1.1340 | Neg. CHF rate of 0.75% introduced | -9809x125k | +26.2 bn per week | 428.2 bn | 365.5 bn | 62.7 bn | |
| January 16, 2015 | 0.9988 | 1.1578 | End of EUR/CHF peg | -26444x125k (before end peg) | +13.1 bn per week | 402 bn | 339.6 bn | 62.4 bn | |
| January 9, 2015 | 1.2009 | 1.18 | ECB QE Onset, Brent: 47$ | -24171x125k | 2.4 bn per week | 388.9 bn | 329 bn | 59.7 bn | |
| End December 2014 | 1.2020 | 1.2099 | Rouble crisis, Brent: 54$, neg. CHF interest 0.25% | -16545x125k | 16.5 bn per month | 386.5 bn | 327.7 bn | 58.8 bn | |
| End November 2014 | 1.2026 | 1.2436 | Gold referendum,Brent:69$ | -23424x125k | 3.6 bn per month | 370.6 bn | 319 bn | 51.4 bn | |
| End October 2014 | 1.2028 | 1.2525 | Brent: 84$ | -20283x125k | 0 | 367 bn | 310 bn | 56.4 bn | |
| End September 2014 | 1.2115 | 1.2632 | Brent:91$ | -12557x125k | 0 | 368 bn | 310 bn | 58 bn | |
| End August 2014 | 1.2060 | 1.3128 | Brent: 101$ | -13039x125k | 0 | 367 bn | 310 bn | 57 bn | |
| End July 2014 | 1.2150 | 1.2832 | ECB QE Talk taking effect on markets | -11764x125k | 0 | 368 bn | 310 bn | 58 bn | |
| End June 2014 | 1.2158 | 1.3596 | First ECB easing | -6813x125k (CHF spec.pos turns neg.) | 0 | 368 bn | 301 bn | 67 bn | |
| End May 2014 | 1.2192 | 1.3642 | +13703x125k | 0 | 367 bn | 304 bn | 63 bn | ||
| End Q1, 2014 | 1.2227 | 1.3703 | Ukraine crisis | +14819x125k | 0 | 368 bn | 316 bn | 52 bn | |
| End Q4, 2013 | 1.2303 | 1.3588 | US recovery despite gov. shut-down | +10889x125k | 0 | 364 bn | 319 bn | 45 bn | |
| Previous Record High | 1.2047 | 1.2927 | Nov2012:-3367x.. June2013:-28972x | 12 bn per month total 256 bln. CHF | 373 bn (Nov 2012) | 321 bn (June 2013) | |||
| March 16, 2012 | 1.2040 | 1.3300 | Temporary low in sight deposits | -19812x125k | -4 bn (SNB selling Euros) | 217 bn | 159 bn | 58 bn | |
| December 2011 | 1.2040 | 1.2948 | Markets perceive higher floor thread | -10978x125k | -26 bn (SNB selling Euros) | 221 bn | 180 bn | 41 bn | |
| September 16, 2011 (first record) | 1.2155 | 1.2940 | After establishment of 1.20 floor | +5400x125k (CHF long despite floor) | 58.4 bn (sept 2011) | 247.4 bn | 206 bn | 42 bn | |
| August 2011 | 1.18 | 1.4379 | US Downgrade, ECB intervention | +9342x125k | 159 bn (Aug 2011) | 189 bn | 164 bn | 25 bn | |
| July 2011 | 1.12 | 1.4396 | SNB absorbs liquidity with SNB bills | +7877x125k | -71 bn (SNB sterilizes via SNB bills) | 30 bn (Thirty) | |||
| May/June 2010 | 1.40 | 1.2306 | SNB abandons interventions | -12810x125k | 24 bn | 101 bn | |||
| May 02 2009 | 1.5164 | 1.41 | First high during fin. crisis | -4922x125k | 77 bn | ||||
| May/June 2010 | 1.40 | 1.2306 | SNB abandons interventions | -12810x125k | 24 bn | 101 bn | |||
| May 02 2009 | 1.5164 | 1.41 | First high during fin. crisis | -4922x125k | 77 bn |
Q&A
Roger: Are there other explanations than interventions for increased sight deposits?
George Dorgan: There are two means of financing for current interventions:
1) Sight Deposits (electronic printing)
2) Bank notes (“traditional” money printing)
So when cash is converted into sight deposits at the SNB, then this may happen without interventions. But sight deposits increase.
Roger: The SNB buys in any case, even if the rate is high. Why?
George Dorgan: Yes you are right. But interventions at too high levels, is a potential risk for SNB's solvability. But why does she do it?
1) If the SNB sells the EUR/CHF or does not buy at all, then the EUR would move downwards. The bank does not like this.
2) The SNB wants to support the carry trade, the upwards trend of EUR/CHF.
The conclusion is that the SNB will sell euros from a certain level. In an earlier post, I thought they sell at 1.10 but I got wrong, for now...
Remember that the SNB sold euros in early 2012 so that the euro went slowly towards 1.20.
Roger: Is it possible that money isn’t credited to an account instantly but after a few days, right? Last week the deposits increased. This could be because of interventions in the last week or the week before, right? But in the last two weeks the Euro-Franc exchange rate was pretty high.
George Dorgan:
Speculative positions against CHF (CHF short) may be higher than CHF sight deposits (CHF Long). The CFTC position is only a part of the total spec position. Brokers and foreign banks hedge some of their client EUR long positions with SNB sight deposits or indirectly via Swiss banks like UBS. When and how much they hedge, depends. As January 15th shows, banks are usually not completely hedged.
You might get confused with this answer, read more here why sight deposits can be viewed in two ways, depending who creates them, the central bank SNB or the commercial banks that deposit funds.
For Older Headlines see next page
You Might Also Like
 Household wealth in 2025
2026-04-28
The SNB is today publishing Swiss financial accounts data for Q4 2025. Data on household wealth is thus now available for the whole of 2025.
 Sunday’s Election Prospects Weigh on the Yen
2026-02-04
The dollar enjoys a broadly firmer today, but it is mostly consolidating. The Japanese yen is a notable exception. The greenback reached JPY156.85, its best level since January 23 and does not look as if it has peaked. Sunday’s election is around the corner and polls show Prime Minister Takaichi leading the LDP to a …
 These are NOT LEGO SETS: They are PURE SILVER Building Blocks
2025-12-12
🔔 SUBSCRIBE TO MONEY METALS EXCHANGE ON YOUTUBE
➤ http://bit.ly/mmx-youtube
These are NOT LEGO SETS: They are PURE SILVER Building Blocks
Want to keep your sense of childhood joy while stacking silver bars?
Getting the silver building blocks from Money Metals encourages you to treasure your happiness while building your stack of silver bars.
These silver bars are in the practical yet fun design of traditional building blocks, a remnant of the childhood toys that so many of us loved.
You can create your own stackable designs, build a little house or cabin, build a bridge, build a statue, build whatever your imagination and stacks will allow. The more of these 99.9% pure silver bars you get, the more you can stack, and the more creative you can get.
With each bar weighing one
 Crashprognosen von Michael Burry & Co: Wie beunruhigt solltest Du sein?
2025-12-11
Depot-Vergleich 2025: Die besten Broker & Aktiendepots
Smartbroker+* ► https://www.finanztip.de/link/smartbroker-depot-text-youtube/yt_HTcm8xDNUow
Traders Place* ► https://www.finanztip.de/link/tradersplace-depot-text-youtube/yt_HTcm8xDNUow
Finanzen.net Zero* ► https://www.finanztip.de/finanzennetzero-depot-text-youtube/yt_HTcm8xDNUow
Scalable Capital* ► https://www.finanztip.de/link/scalablecapital-depot-text-youtube/yt_HTcm8xDNUow
Trade Republic
Flatex* ► https://www.finanztip.de/link/flatex-depot-text-youtube/yt_HTcm8xDNUow
ING* ► https://www.finanztip.de/link/ing-depot-text-youtube/yt_HTcm8xDNUow
Comdirect* ► https://www.finanztip.de/link/comdirect-depot-text-youtube/yt_HTcm8xDNUow
Consorsbank* ► https://www.finanztip.de/link/consorsbank-depot-text-youtube/yt_HTcm8xDNUow
S Broker* ►