


George Dorgan
My articles My siteAbout meMy videosMy books
Follow on:LinkedINTwitterSeeking Alpha
CFA SocietyEconomicBlogs
For us the five major drivers of government bond yields are:
- Inflation expectations and inflation: The by far most important criterion. High inflation expectations must be compensated via higher bond yields. The main driver behind inflation expectations is the wage development, this is the form of inflation that typically persists. Price inflation follows inflation expectations with a certain lag.
- Wealth: The higher the wealth of a country, the lower the bond yields. Wealth is typically increased by high savings.
- Regular and irregular influences on bond yields by central banks: Regular: Central banks buy government bonds, in particular in US Dollars, the world reserve currency. Irregular: Central banks buy bonds of their own government and depress yields – the “quantitative easing“.
If a country has relatively low wealth then foreigners must help with the purchase of bonds and the following factors become relevant: - Foreign debt relative to GDP: Foreign bond holders want higher yields against risks (e.g. currency risks) of holding foreign assets.
- The net international investment position (5a) and change in this position, namely the current account balance (5b).
Investors often buy bonds when they need secure income and do not like high fluctuations in price. They are so-called “risk-averse” investors, for example insurances or pension funds.
Criterion 1: High inflation increases government bond yields
Investors want to be compensated for rising prices and inflation; therefore, government bond yields for countries often increase in sync with inflation. More important than effective price inflation rates are inflation expectations.
The main driver behind inflation expectation are wages.
The following graphs from Flassbeck Economics show that wages and unit labour costs (ULC) are the main driver behind inflation expectations.
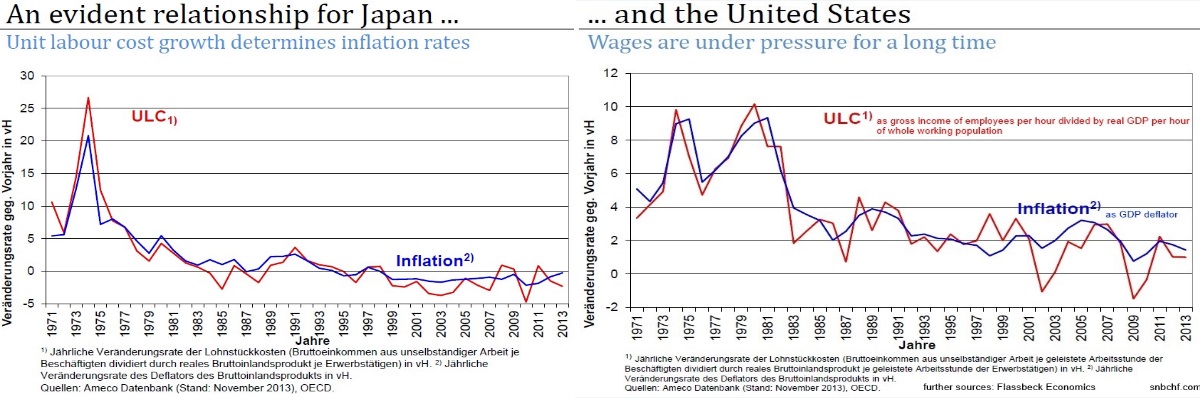
source Flassbeck Economics
The reader should be adverted that a strong relationship between increases of ULC, wages and price inflation is valid in advanced economies that we call “consumption-driven countries“. This is different in Emerging Markets, the countries with a weak capital stock per capita, please see more in the second part of this page,

click to expand: Expected income increase: Best Measurement of Inflation?
Inflation expectations, the “expectation of higher wages” and its descending path
The expectation of higher wages often lets workers anticipate consumption with loans. Consequently credit and money supply increases. Monetarists and Austrian economists see the increase of money supply as a key driver of future price inflation, in particular when companies translate higher wage costs into higher sales prices. But the graph from JP Morgan shows that American wage expectations did not rise much any more since the 1990s, they are rather on a descending path.
We think that once-off price shocks like higher oil prices in the 1970s, the outage of the Japanese nuclear plants in 2011 or recent markets speculation against the yen do not constitute an element that alone can change inflation expectations. Such elements alone do not translate in persistent inflation, we also need wage inflation.
In this post we describe why the Asian collective societies are rather reluctant when asking higher wages. People in countries like Argentina, Brazil and in the past the United States, the UK and Italy tend to be more “active” in demanding higher wages.
Expected inflation and real interest rates

Expected Inflation & Real Interest (source Cleveland Fed) - Click to enlarge
The Cleveland Fed’s estimate of inflation expectations is based on a model that combines information from a number of sources to address the shortcomings of other, commonly used measures, such as the “break-even” rate derived from Treasury inflation protected securities (TIPS) or survey-based estimates. The Cleveland Fed model can produce estimates for many time horizons, and it isolates not only inflation expectations, but several other interesting variables, such as the real interest rate and the inflation risk premium.
Inverted Yield curves:
Government bond yields might fall due to an upcoming recession while inflation figures are still high, example above in 1987, 1992-1994, and at several occasions after 2005. This leads to inverted yield curve.

Japan real yields do not have any significance (Source Financial Times)
Real Interest Rates may be misleading
In the picture the Financial Times shows the big gap between Japanese bond yields and inflation measured by price inflation, the so-called “real interest rates”.
Often real interest rates are very useful for pricing bonds. But this measurement of inflation is misleading here, because it is driven by the yen depreciation and higher import costs, which was a once-off movement.
Strong GDP growth usually leads to less unemployment (Okun’s law) and higher wages and finally price inflation (Phillips curve). The following graph indicates the difference between the 10 year government bond yield and the GDP growth rate since 1980 for 23 OECD countries. It becomes obvious that since 1992, investors were ready to receive lower and lower yields when compared to growth (and implicitly inflation) and be financially repressed by governments and central banks. The only exception was the crisis 2008/ 2009, when inflation was still high, but GDP growth was negative.
Real Interest Rates as “Bond Yield minus Nominal GDP Growth
Nominal GDP growth can often be seen as proxy for inflation. When we exclude population effects, then inflation and nominal growth is strongly related:
Pictet did this exercise and compared the two concepts. Similarly as the graph for inflation expectations above, we see a descending path for nominal GDP growth in the U.S. There are some deviations caused by recessions.

Descending path for Nominal GDP Growth (In summer 2013, Pictet foresaw strong US growth)
Bond yields minus GDP Growth for OECD countries
The following graph set in relation government bond yields with nominal GDP growth. The descending path for real The OECD represents the more developed states in the world.
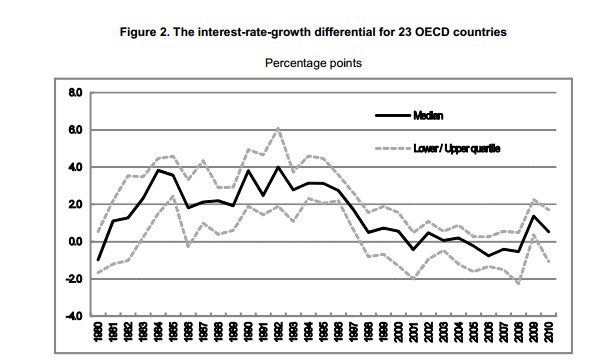
Government Bond Yields Minus GDP Growth for 23 OECD Countries (source OECD)
Criterion 2: Countries with higher wealth have lower bond yields
A government needs to pay less for its debt when it and its inhabitants have high wealth.This reduces risks; theoretically the government could collect higher taxes and reduce the debt. Higher wealth means more competition for safe assets like government bonds, the competition in wealthy nations is therefore higher, because risk-averse investors typically save in the local currency.
Wealth increases with high local savings, with current account surpluses (criterion 5b) or with an increase of asset prices. The graph from the French economist Thomas Piketty shows that – mostly thanks to rising asset prices – private wealth has increased since the 1990s – precisely during the period when real interest rates were falling. Parallel to higher private wealth, government debt inched up.

Wealth is defined as assets minus liabilities, source Thomas Piketty
Criterion 3: Central banks’ demand for government bonds
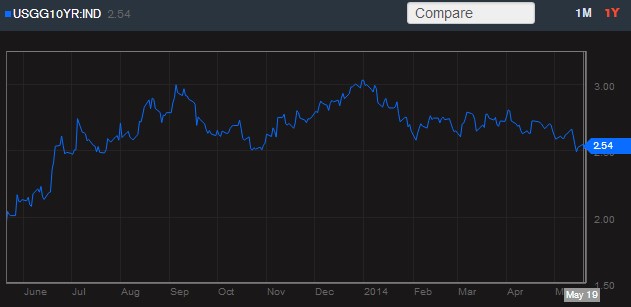
US 10 year Treasuries 2013-2014
Central banks influence government bond yield on a regular basis. The most prominent regular examples are the central banks of Japan, China and many emerging economies that buy US dollars, the world reserve currency, to invest their current account surpluses. Quantitative easing constitutes an irregular example of central bank influence, the U.S. Fed or the Bank of Japan buy the bonds of their own government to make these bonds less attractive in comparison to stocks and other risky assets. In summer 2013 talks about “tapering”, U.S. Treasury yields have strongly risen, because one big bond buyer, namely the U.S. Fed, might reduce its purchases.

Read on the second page about the criteria 4 and 5 that are particularly important for emerging markets. Furthermore we speak about recent discussions initiated by Kyle Bass and the Modern Monetary Theory, in particular as for Abenomics.


