


Lance Roberts
My articles My offerMy siteAbout meMy videosMy books
Follow on:TwitterSeeking AlphaFacebookAmazon
| In this short video, I cover the record $1.2T in U.S. buybacks, flat profit margins outside tech, and Europe’s lagging data capacity. I also touch on tightening liquidity, rising debt-fueled AI investment, and echoes of the 1990s boom that point to hidden risks beneath the surface — everything you need in one visual market update. 🐦Follow me on X: https://x.com/LanceRoberts Catch me daily on The Real Investment Show: https://www.youtube.com/@TheRealInvestmentShow |
You Might Also Like
 10-17-25 The Leverage Trap: Why The Next Selloff Could Be Brutal
2025-10-18
Leverage drives bull markets higher—but when sentiment shifts, it accelerates the fall.
In this Short video, I explain how margin debt above $1 trillion fuels gains today but can trigger a rapid, cascading selloff when the tide turns. $SPX $QQQ
Full episode:
Catch me daily on The Real Investment Show: https://www.youtube.com/@TheRealInvestmentShow
 10-15-25 The Fed’s Quiet Pivot: Ending QT Is Bullish for Risk Assets
2025-10-15
The Fed just made a quietly bullish move. In this short video, I explain how ending quantitative tightening and stabilizing its balance sheet adds liquidity, supports Treasuries, and sets up a stronger backdrop for risk assets.
Full episode:
Catch me daily on The Real Investment Show: https://www.youtube.com/@TheRealInvestmentShow
 10-15-25 Is the Fed Poised to Pause Quantitative Tightening?
2025-10-15
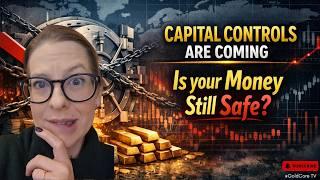
Federal Reserve Chair Jerome Powell just hinted that the Fed may soon pause its balance-sheet runoff — a potential shift that could reshape market liquidity and investor sentiment.
Lance Roberts breaks down:
* Why the Fed may pause QT — and what it signals about financial conditions.
* How ending balance-sheet runoff affects liquidity, yields, and asset prices.
* What history tells us about QT pauses and subsequent market rallies.
* Why the Fed’s portfolio composition (Treasuries vs. MBS) still matters for inflation and housing.
* Portfolio tactics if the liquidity tide begins to turn.
#FederalReserve #QuantitativeTightening #FedPolicy
#MarketLiquidity #StockMarketAnalysis
2025-10-13
The First Brands Group, manufacturer of auto parts, including Raybestos brakes and FRAM, filed for bankruptcy on September 29th. This bankruptcy is troubling in two ways. First, per the ZeroHedge chart below, the price of First Brands loans fell by 80% in a day. In other words, the loan market had no clue of financial …
Tags: Featured,newsletter


3 pings