Lance Roberts
My articles My offerMy siteAbout meMy videosMy books
Follow on:TwitterSeeking AlphaFacebookAmazon
| Markets are priced for perfection heading into next year. Earnings expectations are unusually high. If those forecasts get revised lower, the market will have to reprice quickly. In this short video, Lance Roberts explains why high valuations and aggressive earnings forecasts create real revision risk if results fail to measure up. 📺Full episode: -vnHx4Eg Catch me daily on The Real Investment Show: https://www.youtube.com/@TheRealInvestmentShow |
You Might Also Like
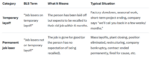
Permanent Job Losers: A Worrying Facet Of Today’s Economy
2025-11-24
Given the two-month delay, Thursday’s BLS employment report on September labor market conditions was not nearly as pertinent as the BLS data typically is. Despite it being old news, it is worth sharing that the number of jobs increased by 119k, but the unemployment rate ticked up from 4.3% to 4.4%. The markets didn’t seem …
11-26-25 Confidence, Chaos, and The K-Shaped Economy
2025-11-19
Peter Atwater, one of the leading voices on confidence-driven behavior in markets and society, joins Lance Roberts to share how certainty, control, and herd mentality shape every major trend investors face today.
Lance and Peter discuss The Confidence Map, why people behave differently when they’re in the “comfort zone” versus the “stress center,” and how these shifts explain the rise of speculative investing, the bifurcated K-shaped economy, and the growing disconnect between Wall Street and Main Street.
#PeterAtwater #BehavioralFinance #KShapedEconomy #InvestorPsychology #AIandMarkets
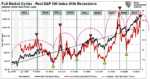
Full Market Cycles: Half Bull and Half Bear
2025-11-17
Last week, we discussed the importance of “math” as it relates to valuations and noted the importance of understanding “full market cycles.” To wit: “The math on forward return expectations, given current valuation levels, does not hold up. The assumption that valuations can fall without the price of the markets being negatively impacted is also grossly flawed. …
10-3-25 Forget the Shutdown, Jobs Are Getting Weaker and Weaker
2025-10-03
The real story isn’t the government shutdown. ADP just showed another 32,000 job losses, with prior months revised lower.
In this short video, @michaellebowitz and I discuss why the labor market is deteriorating even without the BLS report and what it means for $SPY / $QQQ.
Full episode:
Catch me daily on The Real Investment Show: https://www.youtube.com/@TheRealInvestmentShow
RSI (Relative Strength Index): Timing The Next Correction
2025-09-29
In the world of technical analysis, there is one reliable indicator for measuring market risk. The relative strength index (RSI) measures overextension (in either direction). Developed by J. Welles Wilder in 1978, the RSI is a momentum oscillator. As such, it measures the velocity and magnitude of price changes, plotting those on a scale from 0 …
9/24/25 Strange Recession Signals: What Markets & Odd Indicators Are Telling Us
2025-09-24
Are we really on the edge of a recession—or are investors just overthinking the signals?
Beyond unemployment and consumer spending, unusual data points like men’s underwear sales, cardboard box demand, and even giant Halloween skeleton purchases are popping up as quirky economic indicators.
Lance Roberts & Danny Ratliff break down:
• Traditional recession signals like jobless claims, consumer spending, and market fundamentals.
• Technical market warnings investors can’t ignore.
• Why strange metrics like cardboard boxes and holiday spending trends might reveal cracks in the economy.
• The psychology driving investors to go “all in” or “head for the exits.”
0:18 – The Dichotomy of Economic Data
4:43 – When Stocks are "Richly Valued"
8:42 – The Economic Indicators of Recession
16:02
8-4-25 Bull Streak Ends As August Begins
2025-08-04
The historic stock market bull streak has finally come to an end as August kicks off, raising concerns about seasonal weakness, rising volatility, and technical breakdowns. Lance Roberts breaks down what triggered the reversal, how meme stock speculation is adding risk, and what the August-September period historically means for investors.
We’ll analyze key technical indicators on the S&P 500, NASDAQ, and Dow Jones, discuss the latest earnings reports, and provide insights on how to navigate the market correction risks.
📊 Topics Covered:
Why the bull streak ended at the 20-DMA
August seasonality and historical market patterns
Technical analysis of S&P 500 and key sectors
Risks of meme stock speculation & retail euphoria
Portfolio strategies for increased volatility
👉 Stay
A Ponzi Scheme: The Graph Driving MicroStrategy And Others
2025-07-30
The graph below, from Michael Green (@profplum99), is the best way to show the logic that drives a Ponzi scheme in Bitcoin. The Ponzi scheme graph illustrates that there is a robust correlation between changes in the amount of Bitcoin held in funds (ETFs) and the price change. Simply, as new capital is used to …
Tags: Featured,newsletter


