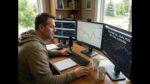
| The 1hr timeframe gives us a good balance between a quick heads up of what may happen (so far, bulls seem to be holding the price above the recent breakout, although things can still change with the post FOMC volatility) without looking at a timeframe that is too small, like the 5 min. Always trade and invest at your own risk only and remember that volatility is no stranger to FMOC evens, including the day after. In this video, I break down the Dow Jones technical setup on the hourly chart following last night’s FOMC meeting. The Dow is currently sitting near yesterday’s close, and traders are wondering what comes next. I walk through a bull flag pattern, explain how the breakout happened during the FOMC reaction, and show how price made a clean retest of the upper trendline and the anchored VWAP from December 9. I also highlight a key level around 47,875, which may signal weakening bullish momentum if price falls below it for more than a couple of hourly candles. This video gives a clear, noise free look at the Dow using the hourly timeframe and helps you understand where the market may go next — while reminding you that post-FOMC volatility can continue. Watch the full analysis and follow the key levels and scenarios to guide your own decision making. See more at: https://investinglive.com/technical-analysis/dow-jones-technical-analysis-after-last-nights-fomc-bulls-holding-20251211/ |
You Might Also Like
 AUDUSD Technicals: The AUDUSD is correcting lower ahead of the RBA rate decision
2025-12-08
The RBA is expected to keep rates unchanged. What is the technical roadmap for traders through the rate decision?
 EURUSD Technicals: EURUSD falls below the 100 day MA, 100 hour MA and 38.2% retracement
2025-12-05
The three key resistance levels for the EURUSD come in from 1.16398 up to 1.1644. Staying below is more bearish.
 Stocks are higher, yields are lower and the USD is lower. How about the technicals?
2025-12-03
In this video, I take a look at the technical driving the 3 major currency pairs to kickstart the new trading day – the EURUSD, USDJPY and GBPUSD. What are the technicals telling traders about the bias, risk and targets.
AUDUSD Technicals:The AUDUSD has traded down and up and is back near unchanged. What next?
2025-12-01
The AUDUSD is trading up and down but with defined support and resistance targets giving traders the roadmap to start the new trading week.
 GBPUSD consolidates and waits for the next shove
2025-10-13
The swing area between 1.3323 to 1.3341 is keeping the pair confined as traders await the next shove
investingLive is a real-time market news and analysis platform, built on the legacy of ForexLive. Covering forex, stocks, commodities, and global markets, it delivers fast, reliable updates to support informed trading and investment decisions. With a global team of expert analysts, investingLive combines speed and clarity to keep professionals ahead of market moves, 24/7.
Tags: Featured,newsletter