Tag Archive: WTI
Harvey’s Muted (Price) Impact On Oil
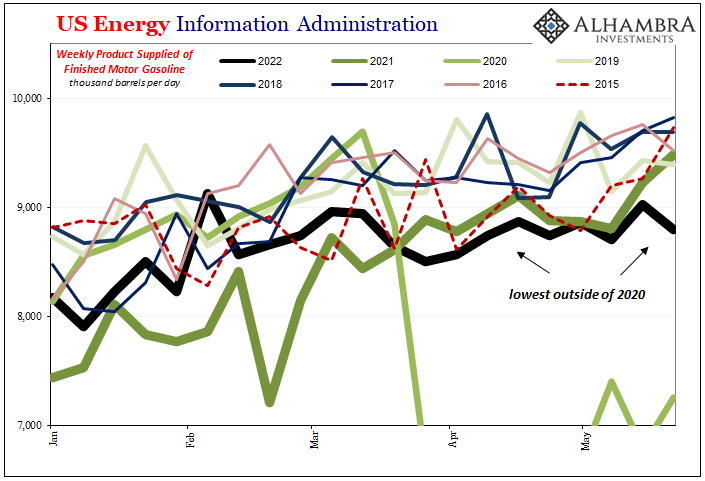
The impact of Hurricane Harvey on the Gulf energy region is becoming clear. There have been no surprises to date, even though the storm did considerable damage and shuttered or disrupted significant capacity. Most of that related to gasoline, which Americans have been feeling in pump prices.
Read More »
Read More »
COT Report: Black (Crude) and Blue (UST’s)
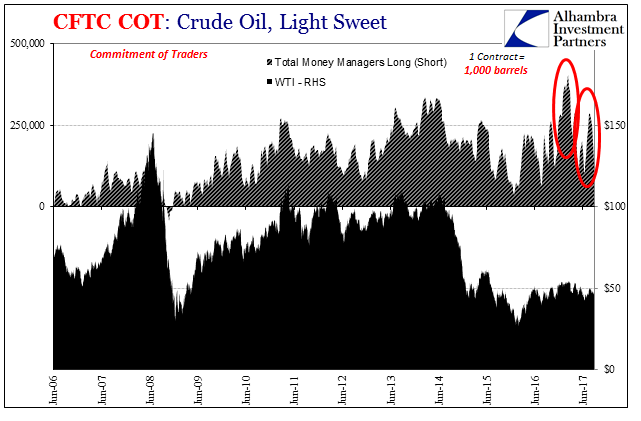
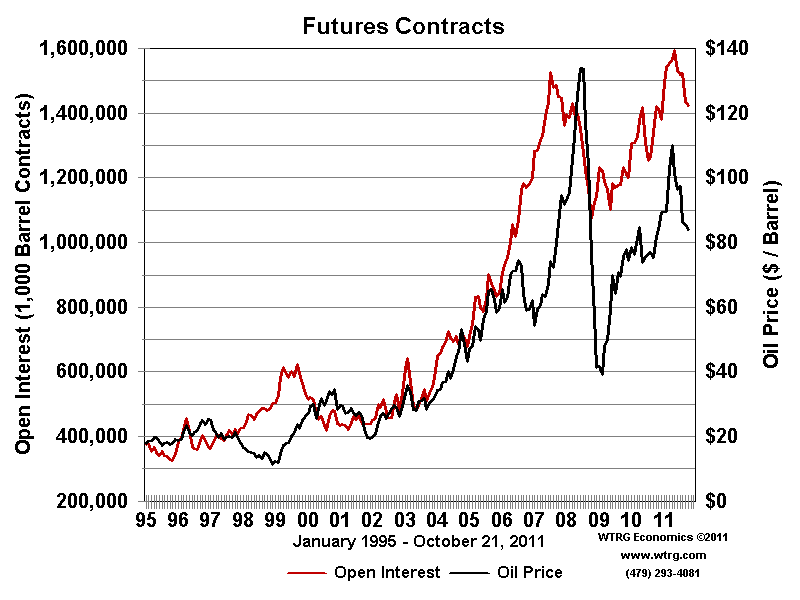
Over the past month, crude prices have been pinned in a range $50 to the high side and ~$46 at the low. In the futures market, the price of crude is usually set by the money managers (how net long they shift). As discussed before, there have been notable exceptions to this paradigm including some big ones this year.
Read More »
Read More »
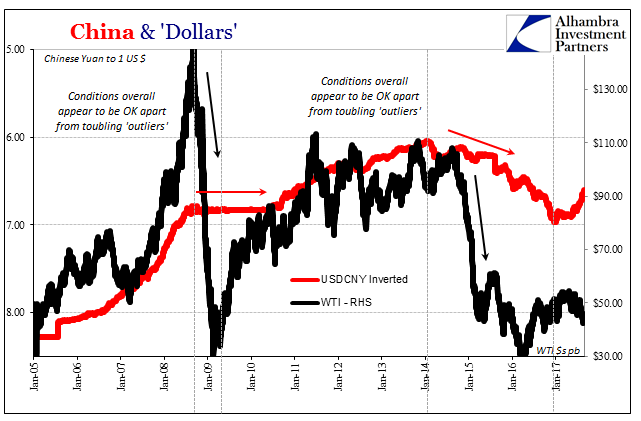
Moscow Rules (for ‘dollars’)
In Ian Fleming’s 1959 spy novel Goldfinger, he makes mention of the Moscow Rules. These were rules-of-thumb for clandestine agents working during the Cold War in the Soviet capital, a notoriously difficult assignment. Among the quips included in the catalog were, “everyone is potentially under opposition control” and “do not harass the opposition.” Fleming’s book added another, “Once is an accident. Twice is coincidence. Three times is an enemy...
Read More »
Read More »
Oil Prices and Manufacturing PMI: No Backing Sentiment
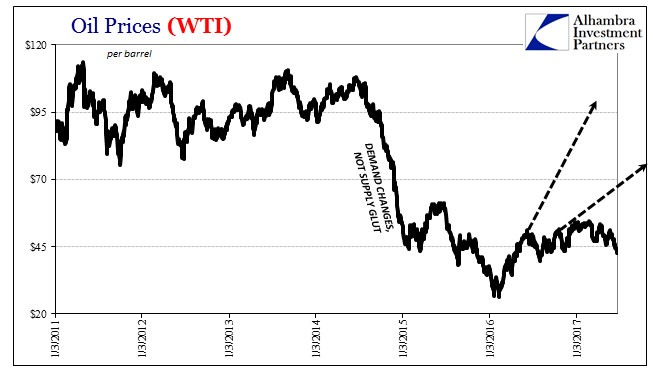
When the price of oil first collapsed at the end of 2014, it was characterized widely as a “supply glut.” It wasn’t something to be concerned about because it was believed attributable to success, and American success no less. Lower oil prices would be another benefit to consumers on top of the “best jobs market in decades.”
Read More »
Read More »
Fading Further and Further Back Toward 2016
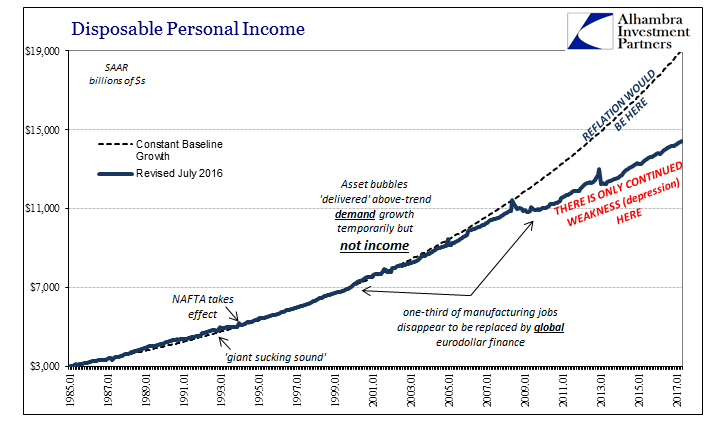
Earlier this month, the BEA estimated that Disposable Personal Income in the US was $14.4 trillion (SAAR) for April 2017. If the unemployment rate were truly 4.3% as the BLS says, there is no way DPI would be anywhere near to that low level. It would instead total closer to the pre-crisis baseline which in April would have been $19.0 trillion. Even if we factor retiring Baby Boomers in a realistic manner, say $18 trillion instead, what does the...
Read More »
Read More »
American Expectations, Chinese Prices
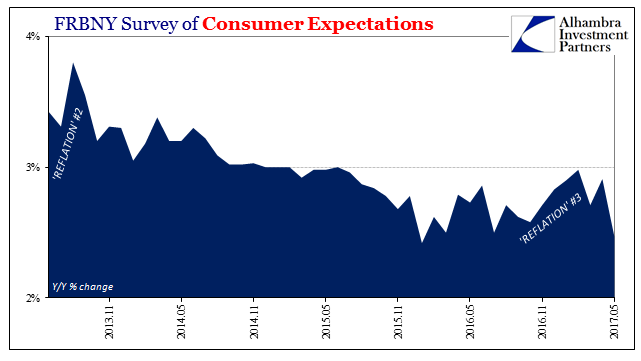
The Federal Reserve Bank of New York has for the past almost four years conducted its own assessment of consumer expectations.Though there are several other well-known consumer surveys, FRBNY adding another could be helpful for corroborating them. Unfortunately for the Fed, it has.
Read More »
Read More »
All About Inventory
Andy Hall has been called the God of Oil. As chief of Astenbeck Capital, he has proven at times that even gods can be mortal. In the “rising dollar” period, for example, after making money on the way down Mr. Hall went bullish.
Read More »
Read More »
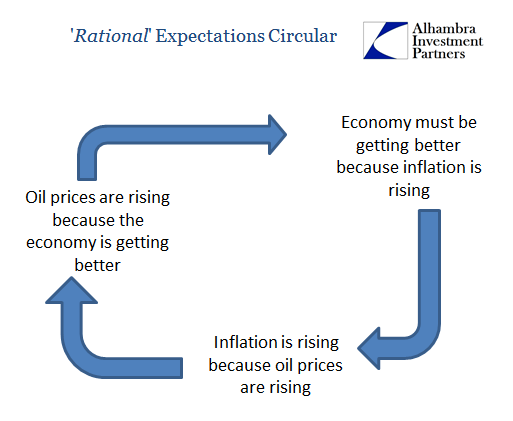
Inflation Is Oil, But Inflation Is Much More Than Consumer Prices
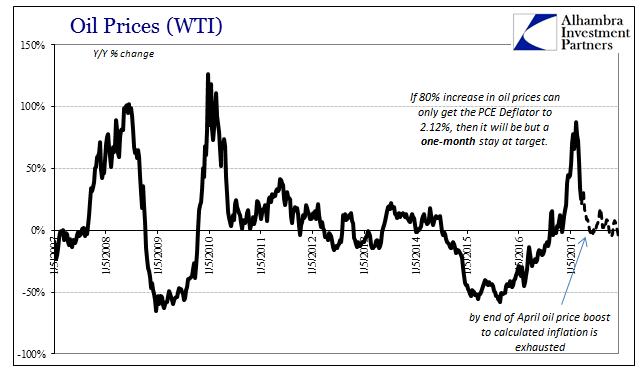
The average annual change in the WTI benchmark price was in April about 25%. That was still a sizable increase year-over-year, and just marginally less than March’s average of 33%. For calculated inflation rates, it represents the last of the base effects that have to this point made it appear as if economic improvement was possibly serious.
Read More »
Read More »
February US Trade Disappoints
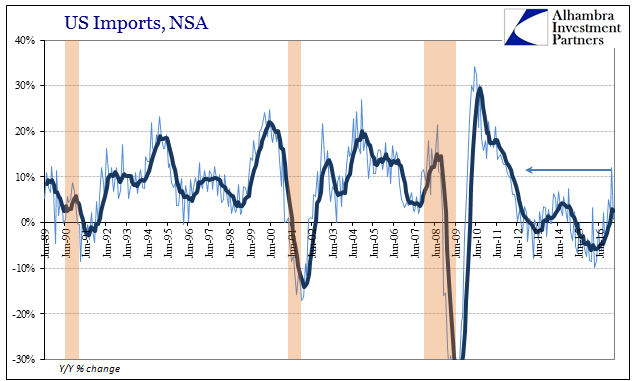
The oversized base effects of oil prices could not in February 2017 push up overall US imports. The United States purchased, according to the Census Bureau, 71% more crude oil from global markets this February than in February 2016. In raw dollar terms, it was an increase of $7.3 billion year-over-year. Total imports, however, only gained $8.4 billion, meaning that nearly all the improvement was due to nothing more than the price of global oil.
Read More »
Read More »
The Power of Oil
For the first time in 57 months, a span of nearly five years, the Fed’s preferred metric for US consumer price inflation reached the central bank’s explicit 2% target level. The PCE Deflator index was 2.12% higher in February 2017 than February 2016. Though rhetoric surrounding this result is often heated, the actual indicated inflation is decidedly not despite breaking above for once.
Read More »
Read More »
Economics Through The Economics of Oil
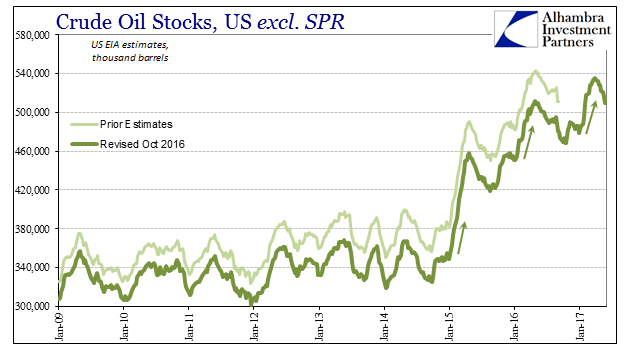
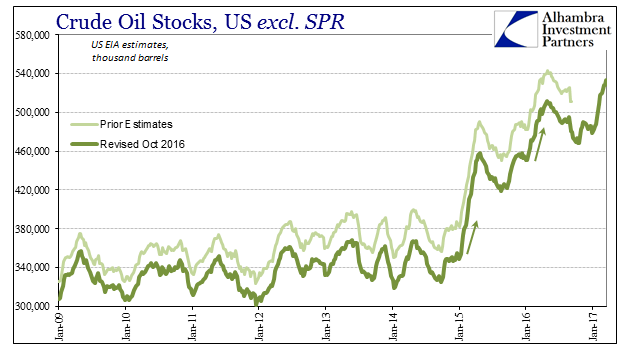
The last time oil inventory grew at anywhere close to this pace was during each of the last two selloffs, the first in late 2014/early 2015 and the second following about a year after. Those events were relatively easy to explain in terms of both price and fundamentals, though the mainstream managed to screw it up anyway (“supply glut”).
Read More »
Read More »
Time, The Biggest Risk
If there is still no current or present indication of rising economic fortunes, and there isn’t, then the “reflation” idea turns instead to what might be different this time as compared to the others. In 2013 and 2014, it was QE3 and particularly the intended effects (open ended and faster paced, a bigger commitment by the Fed to purportedly do whatever it took) upon expectations that supposedly set it apart from the failures of QE’s 1 and 2. This...
Read More »
Read More »
US Trade Skews
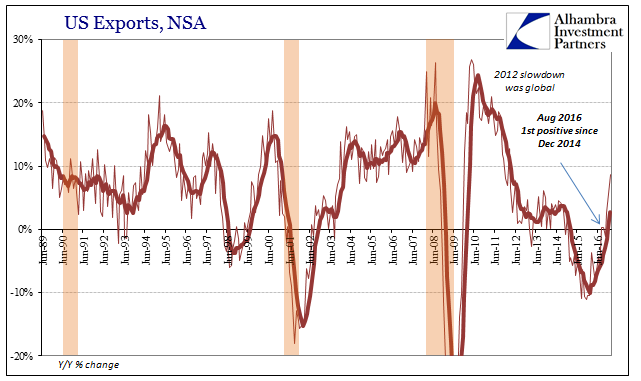
US trade statistics dramatically improved in January 2017, though questions remain as to interpreting by how much. On the export side, US exports of goods rose 8.7% year-over-year (NSA). While that was the highest growth rate since 2012, there is part symmetry to account for some of it.
Read More »
Read More »
Economic Dissonance, Too
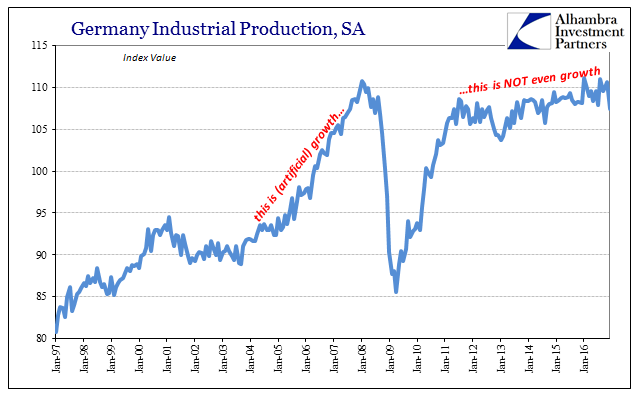
Germany is notoriously fickle when it comes to money, speaking as much of discipline in economy or industry as central banking. If ever there is disagreement about monetary arrangements, surely the Germans are behind it. Since ECB policy only ever attains the one direction, so-called accommodation, there never seems to be harmony.
Read More »
Read More »
Why Aren’t Oil Prices $50 Ahead?
Right now there are two conventional propositions behind the “reflation” trade, and in many ways both are highly related if not fully intertwined. The first is that interest rates have nowhere to go but up. The Fed is raising rates again and seems more confident in doing more this year than it wanted to last year. With nominal rates already rising in the last half of 2016, and with more (surveyed) optimism than even 2014, it may at times seem the...
Read More »
Read More »
U.S. CPI after the energy push
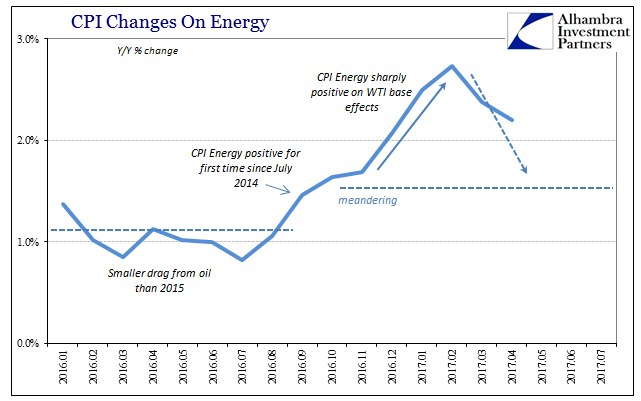
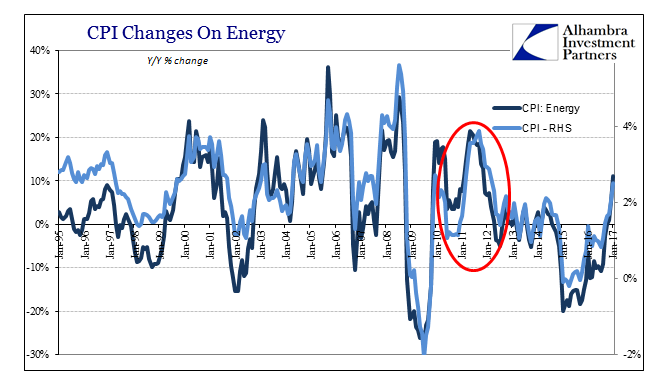
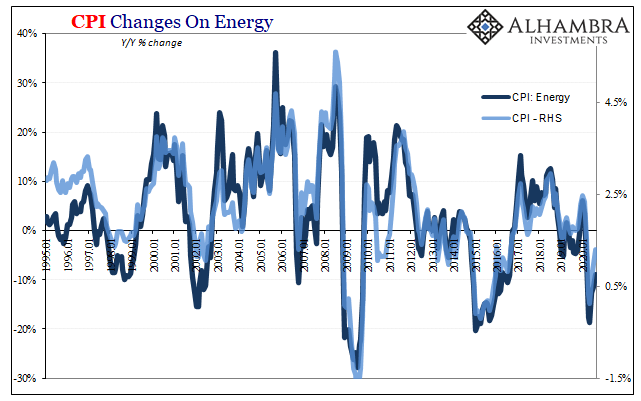
The Consumer Price Index for January 2017 rose 2.5%, pulled upward by its energy component which thanks to oil prices now being comparing to the absolutely lows last year saw that part of the index rise 11.1% year-over-year. Given that oil prices bottomed out on February 11, 2016, this is the last month where oil prices and thus energy inflation will be at its most extreme (except, of course, should WTI actually rise between now and the end of...
Read More »
Read More »


