Read More »


 On Swiss National Bank
  Main SNB Background Info


 Is It Being Demanded?
29 May 2022
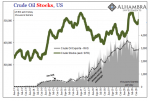
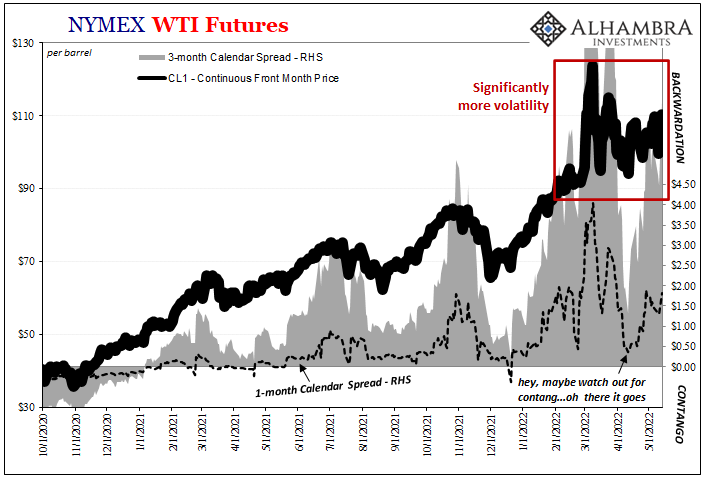 Crude Contradictions Therefore Uncertainty And Big Volatility
18 May 2022
 Playing Dominoes
19 Dec 2021
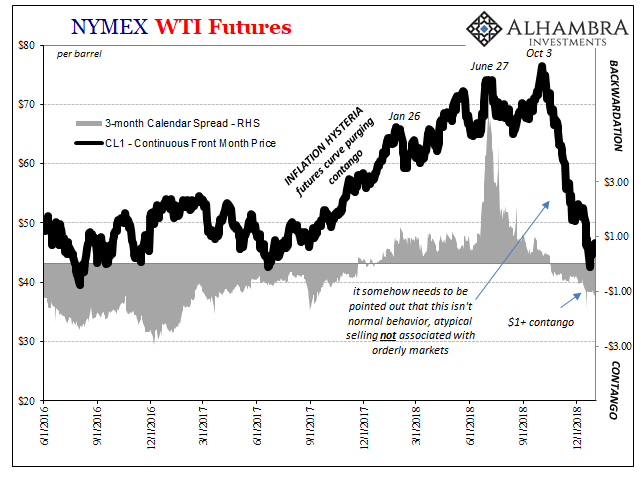
 Inflation Hysteria #2 (WTI)
12 Dec 2020
 Extending the Summer Slowdown
20 Nov 2020
 Counting The Corroborated Stall, Not The Coming Lawfare Election Mess
6 Nov 2020
 What’s Going On, And Why Late August?
29 Oct 2020
 Inflation Karma
15 Sep 2020
 Bottleneck In Japanese
9 Sep 2020
 A Big One For The Big “D”
13 May 2020
 COT Black: No Love For Super-Secret Models
1 May 2020
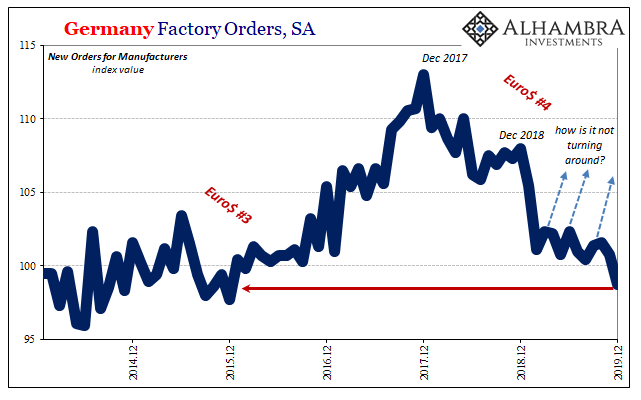 COT Black: German Factories, Oklahoma Tank Farms, And FRBNY
9 Feb 2020
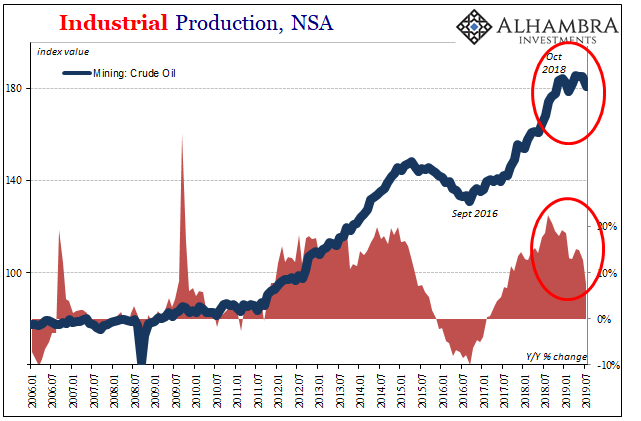 US Industrial Downturn: What If Oil and Inventory Join It?
16 Aug 2019
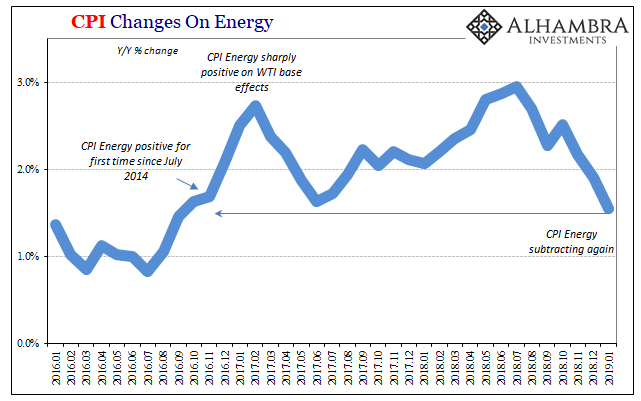 Inflation Falls Again, Dot-com-like
16 Feb 2019
 Nothing To See Here, It’s Just Everything
4 Jan 2019
 Wasting the Middle: Obsessing Over Exits
28 Dec 2018
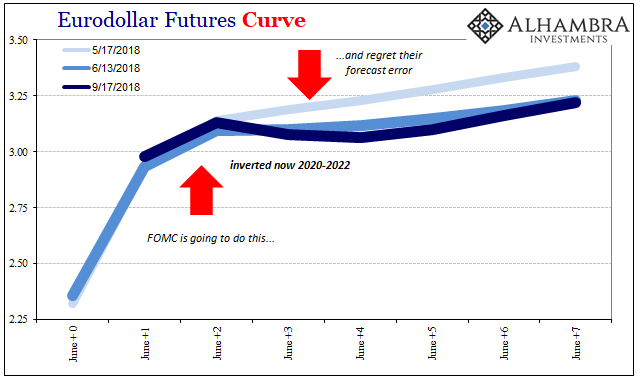 Eurodollar Futures: Powell May Figure It Out Sooner, He Won’t Have Any Other Choice
20 Nov 2018
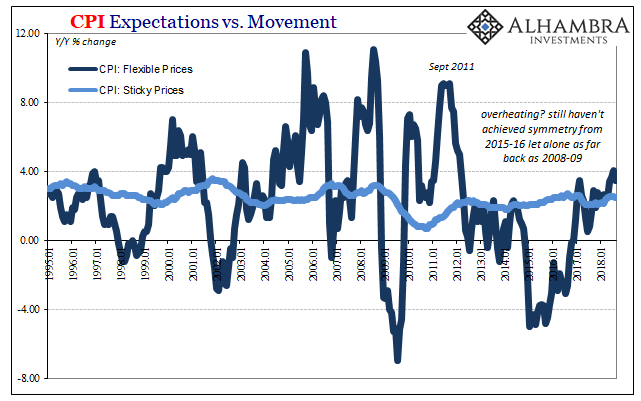 Downslope CPI
16 Sep 2018
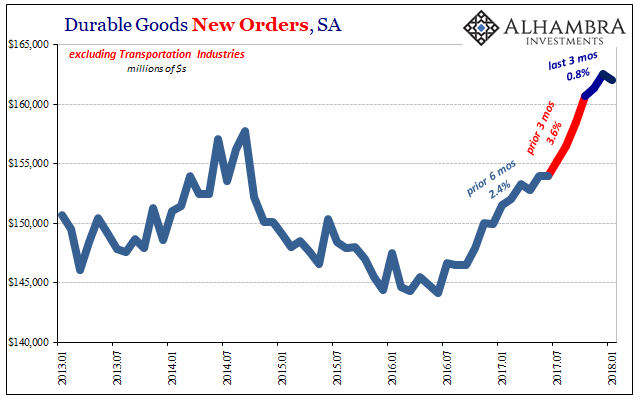 Durable and Capital Goods, Distortions Big And Small
4 Mar 2018
 Reduced Trade Terms Salute The Flattened Curve
10 Dec 2017