Tag Archive: S&P 500 Index
Riding the Type 3 Mega Market Melt Up Train
Beta-driven Fantasy. The decade long bull market run, aside from making everyone ridiculously rich, has opened up a new array of competencies. The proliferation of ETFs, for instance, has precipitated a heyday for the ETF Analyst. So, too, blind faith in data has prompted the rise of Psychic Quants… who see the future by modeling the past.
Read More »
Read More »
Markets That Live by the Fed, Die by the Fed
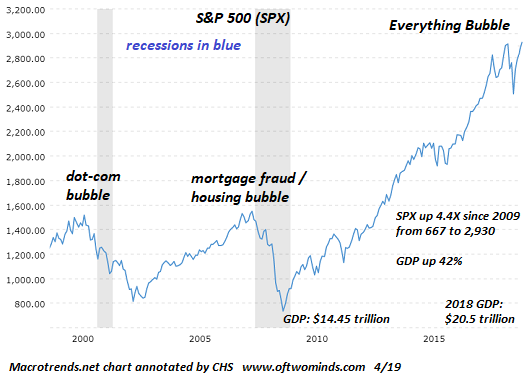
The "everything bubble" is not permanent. All eyes are again on the Federal Reserve, as everyone understands that the Fed is the market-- the stock market, the bond market, the art market, the housing market, etc. All markets have been driven higher by one force: central bank money creation and distribution to the financial sector of financiers and corporations, the richest of the rich.
Read More »
Read More »
The Recline and Flail of Western Civilization and Other 2019 Predictions
The Recline and Flail of Western Civilization and Other 2019 Predictions. “I think it’s a tremendous opportunity to buy. Really a great opportunity to buy.” – President Donald Trump, Christmas Day 2018. Darts in a Blizzard. Today, as we prepare to close out the old, we offer a vast array of tidings.
Read More »
Read More »
Pushing Past the Breaking Point
Schemes and Shams. Man’s willful determination to resist the natural order are in vain. Still, he pushes onward, always grasping for the big breakthrough. The allure of something for nothing is too enticing to pass up.
Read More »
Read More »
Pensions Now Depend on Bubbles Never Popping (But All Bubbles Pop)
We're living in a fantasy, folks. Bubbles pop, period. The nice thing about the "wealth" generated by bubbles is it's so easy: no need to earn wealth the hard way, by scrimping and saving capital and investing it wisely. Just sit back and let central bank stimulus push assets higher.
Read More »
Read More »
A Scramble for Capital
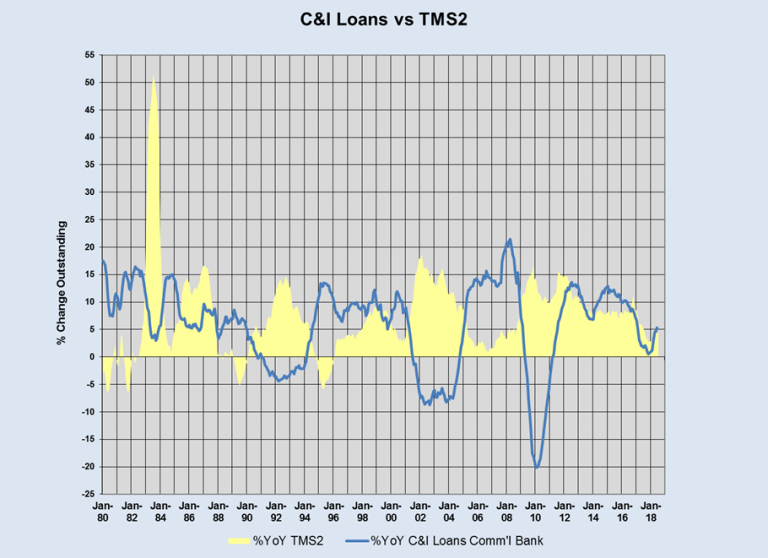
A Spike in Bank Lending to Corporations – Sign of a Dying Boom? As we have mentioned on several occasions in these pages, when a boom nears its end, one often sees a sudden scramble for capital. This happens when investors and companies that have invested in large-scale long-term projects in the higher stages of the production structure suddenly realize that capital may not be as plentiful as they have previously assumed.
Read More »
Read More »
Weekly Technical Analysis: 04/06/2018 – USD/CHF, EUR/JPY, GBP/USD, AUD/USD, WTI
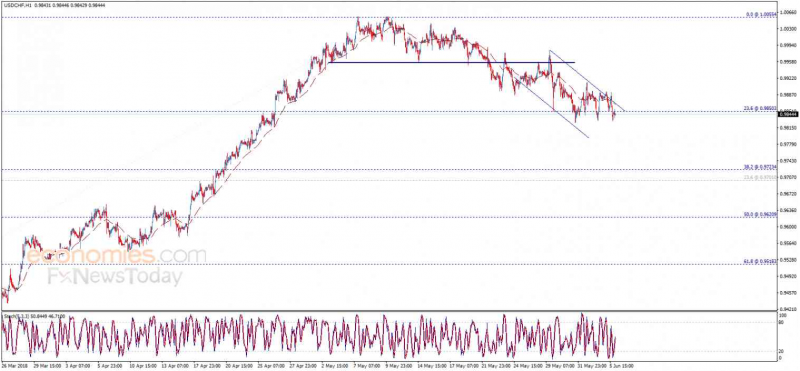
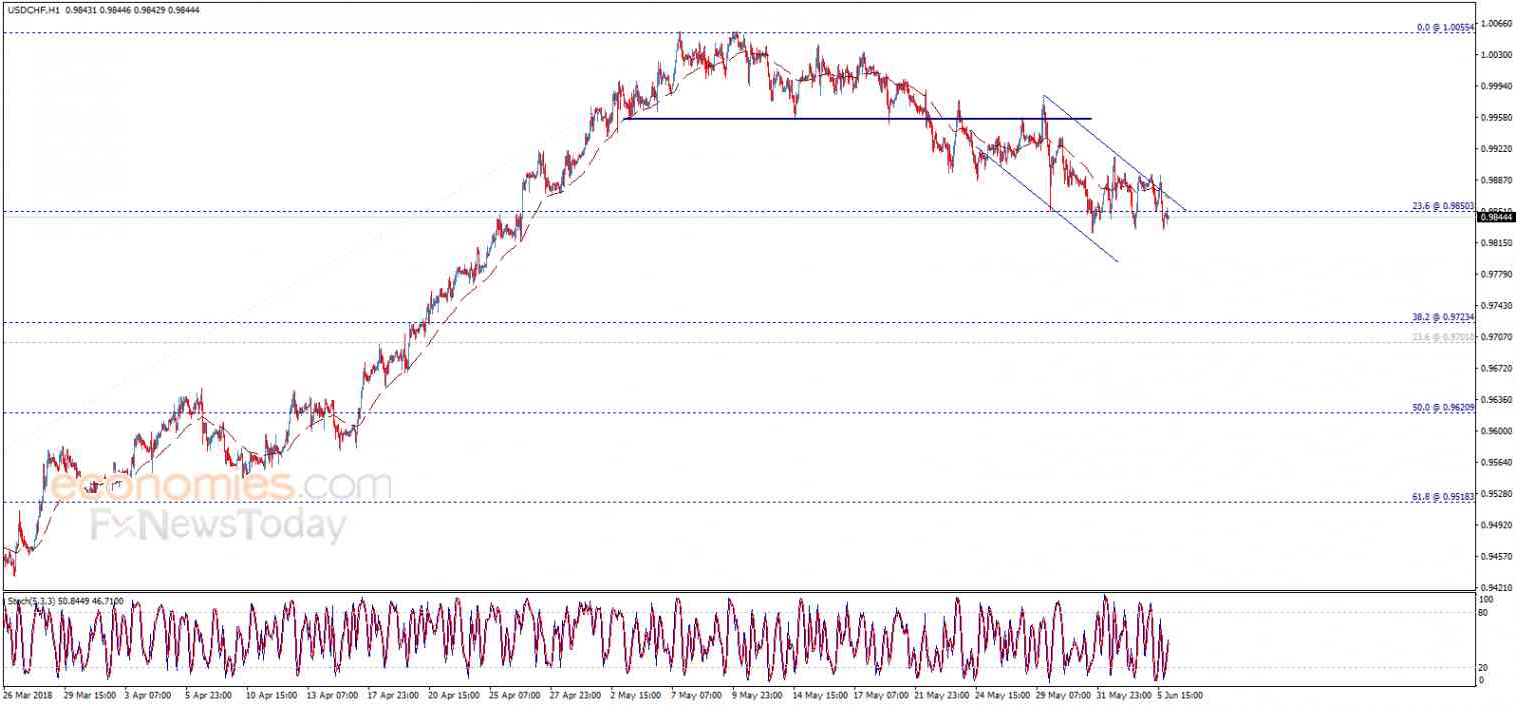
The USDCHF pair managed to break 0.9850 level and closed the daily candlestick below it, which supports the continuation of our bearish overview efficiently in the upcoming period, paving the way to head towards 0.9723 level as a next station, noting that the EMA50 supports the expected decline, which will remain valid for today conditioned by the price stability below 0.9870.
Read More »
Read More »
Weekly Technical Analysis: 21/05/2018 – USD/JPY, EUR/USD, GBP/JPY, USD/CAD, USD/CHF
The USDCHF pair reaches the key support 0.9955 now, and as we mentioned in our last report, breaking this level will confirm completing the double top pattern that appears on the chart, to rally towards our negative targets that begin at 0.9900 and extend to 0.9850. Therefore, we will continue to suggest the bearish trend supported by the negative pressure formed by the EMA50, unless the price managed to rally upwards to breach 1.0055 level and...
Read More »
Read More »
Weekly Technical Analysis: 14/05/2018 – USD/JPY, EUR/USD, EUR/JPY, GBP/USD, USD/CHF
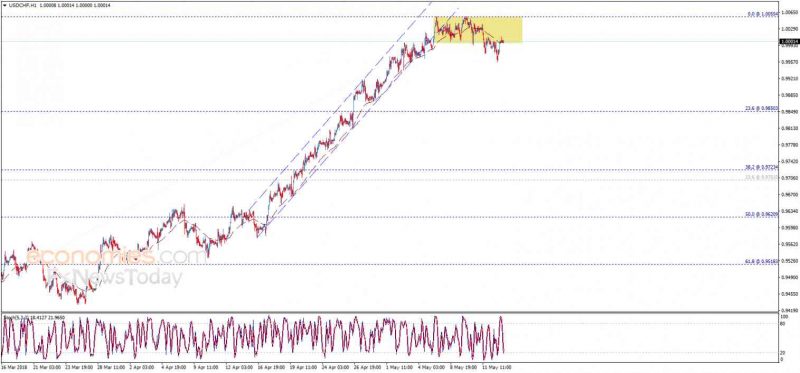
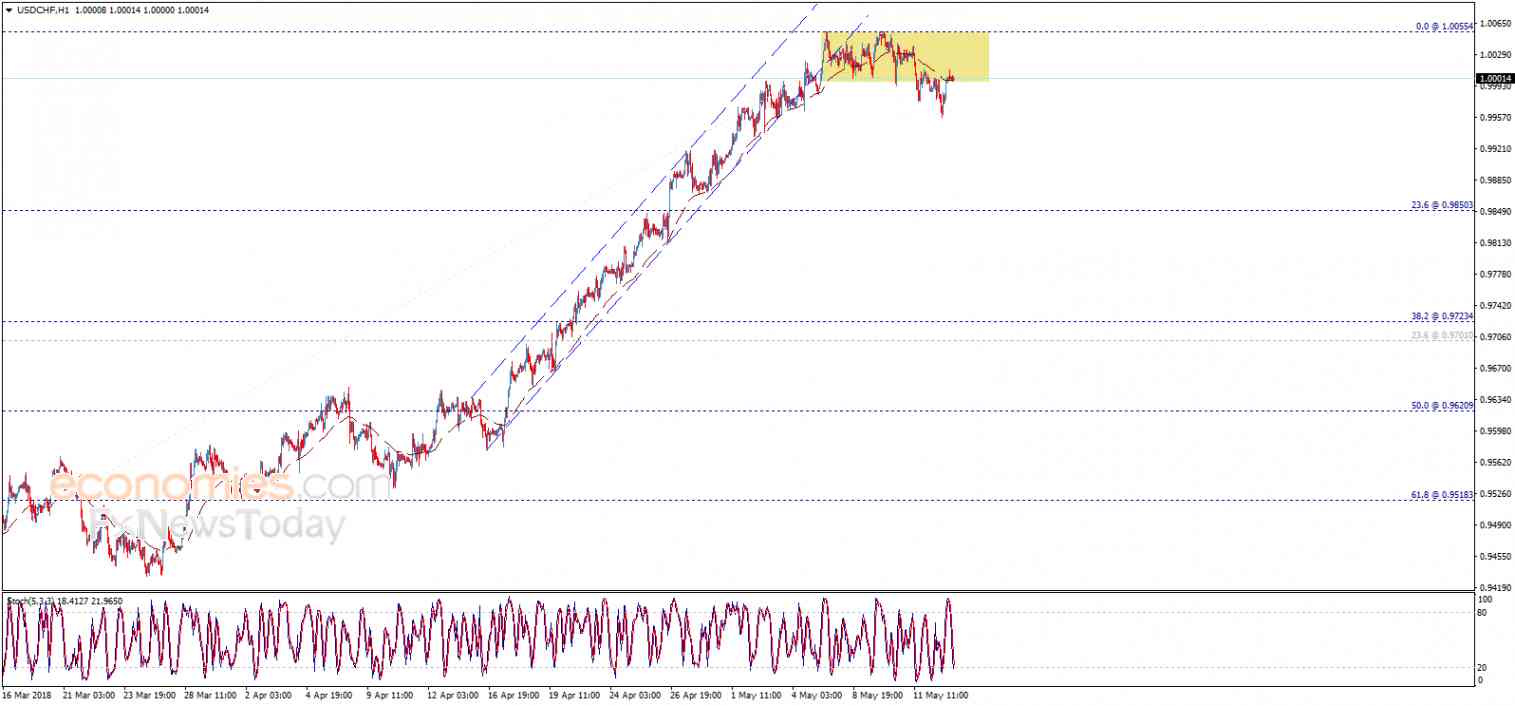
The USDCHF pair provided positive trading yesterday to test 1.0000 level and settles around it, and as long as the price is below this level, our bearish overview will remain valid, noting that our next target is located at 0.9900, while breaching 1.0000 followed by 1.0055 levels represent the key to regain the main bullish trend again. Expected trading range for today is between 0.9920 support and 1.0055 resistance.
Read More »
Read More »
Weekly Technical Analysis: 07/05/2018 – USD/JPY, EUR/USD, GBP/USD, Gold
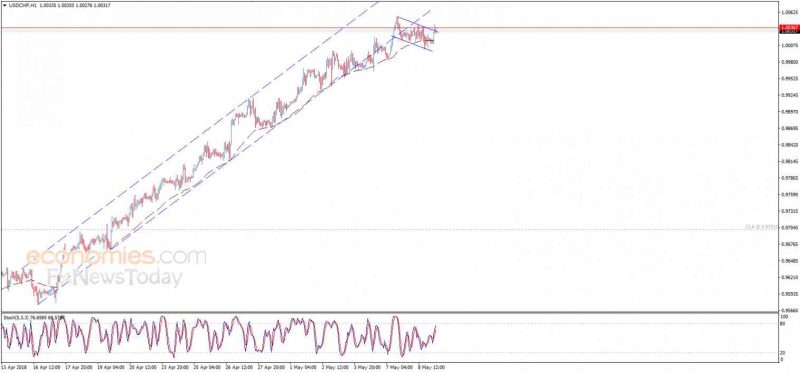
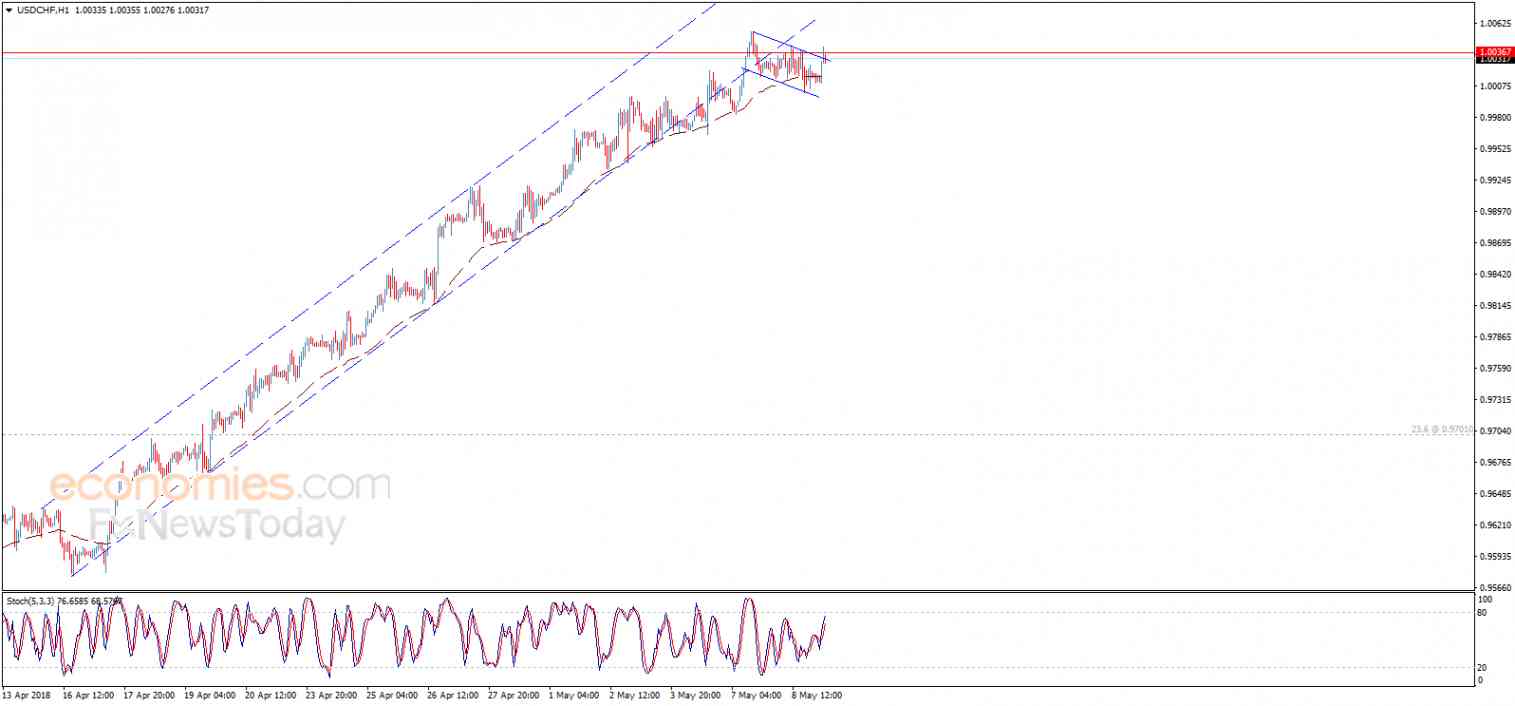
The USDCHF pair’s recent trades are confined within mew minor bearish channel that we believe it forms bullish flag pattern, thus, the price needs to breach 1.0035 to activate the positive effect of this pattern followed by rallying towards our waited target at 1.0100. Therefore, we will continue to suggest the bullish trend supported by the EMA50, unless we witnessed clear break and hold below 1.0000. Expected trading range for today is between...
Read More »
Read More »
Weekly Technical Analysis: 23/04/2018 – USD/JPY, EUR/USD, GBP/USD, AUD/USD, WTI oil futures
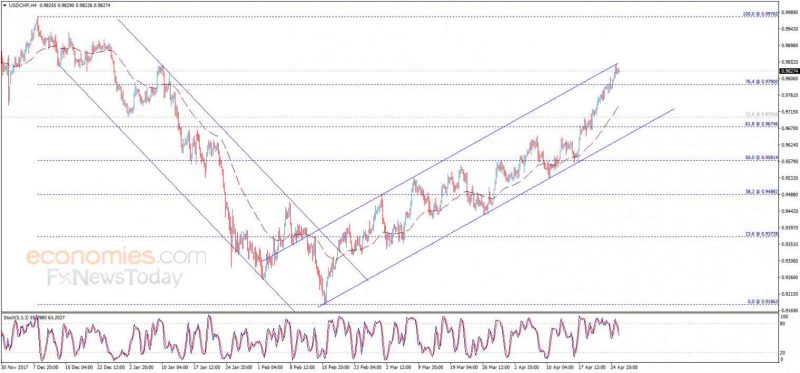
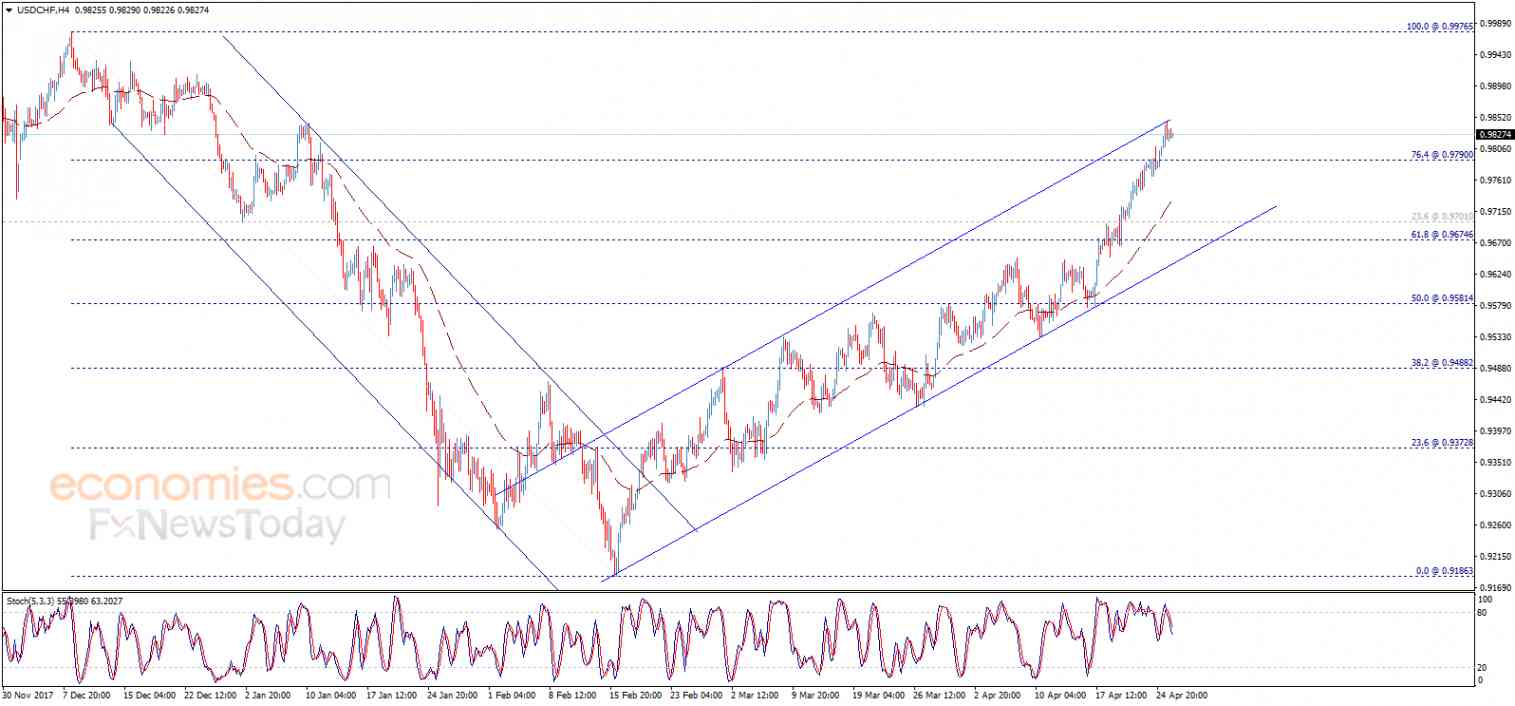
The USDCHF pair touched the bullish channel’s resistance that appears on the chart, and the price might be forced to show some temporary decline to test the support base formed above 0.9790 before resuming the rise again. In general, we will continue to suggest the bullish trend supported by the EMA50, depending on the organized trading inside the mentioned bullish channel, noting that our next target is located at 0.9900, while holding above...
Read More »
Read More »
The “Turn of the Month Effect” Exists in 11 of 11 Countries
I already discussed the “turn-of-the-month effect” in a previous issues of Seasonal Insights, see e.g. this report from earlier this year. The term describes the fact that price gains in the stock market tend to cluster around the turn of the month. By contrast, the rest of the time around the middle of the month is typically less profitable for investors.
Read More »
Read More »
US Stock Market: Happy Days Are Here Again? Not so Fast…
Obviously, assorted crash analogs have by now gone out of the window – we already noted that the market was late if it was to continue to mimic them, as the decline would have had to accelerate in the last week of March to remain in compliance with the “official time table”. Of course crashes are always very low probability events – but there are occasions when they have a higher probability than otherwise, and we will certainly point those out...
Read More »
Read More »
Weekly Technical Analysis: 16/04/2018 – USD/CHF, USD/JPY, EUR/GBP, GBP/USD, USD/CAD
The USDCHF pair breached 0.9675 level and closed the daily candlestick above it, to open the way to achieve more rise in the upcoming sessions, paving the way to head towards 0.9790 as a next main station. Therefore, the bullish trend will be suggested, supported by the EMA50, noting that breaking 0.9675 and holding below it will push the price to test 0.9581 level before determining the next trend clearly.
Read More »
Read More »
Weekly Technical Analysis: 02/04/2018 – Gold, WTI Oil Futures, GER30 Index, USD/JPY
The USDCHF pair attempted to breach 0.9581 level yesterday but it returns to move below it now, which keeps the bearish trend scenario valid until now, supported by stochastic move within the overbought areas, waiting to head towards 0.9488 as a first target.
Read More »
Read More »
Weekly Technical Analysis: 26/03/2018 – USD/JPY, EUR/USD, GBP/USD, AUD/JPY, GBP/JPY, USD/CHF
The USDCHF pair provided negative trades after 0.9488 proved its strength against the recent positive attempts, to keep the bearish trend scenario valid efficiently in the upcoming period, supported by the EMA50 that pushes negatively on the price, waiting to test 0.9373 initially.
Read More »
Read More »
Global Trade War Fears See Precious Metals Gain And Stocks Fall
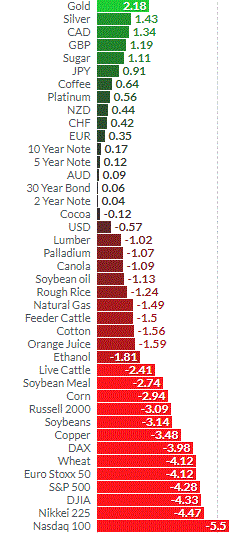
– Market turmoil as trade war concerns deepen and Trump appoints war hawk Bolton
– Oil, gold and silver jump as ‘Russia China Hawk’ Bolton appointed
– Oil up 4%, gold up 2.2% and silver up 1.6% this week (see table)
– Stocks down sharply – Nikkei down 4.5%, S&P 4.3% & Nasdaq 5.5%
– Bolton scares jittery markets already shell-shocked by US’ tariffs against China
– Currency wars and trade wars tend to proceed actual wars
– Gold now...
Read More »
Read More »
US Stock Market – The Flight to Fantasy
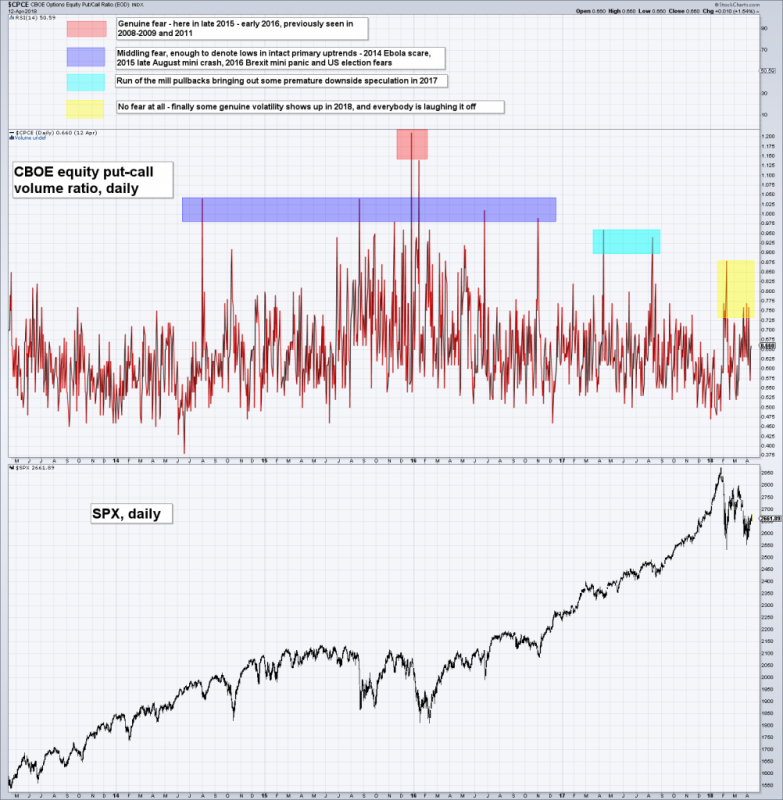
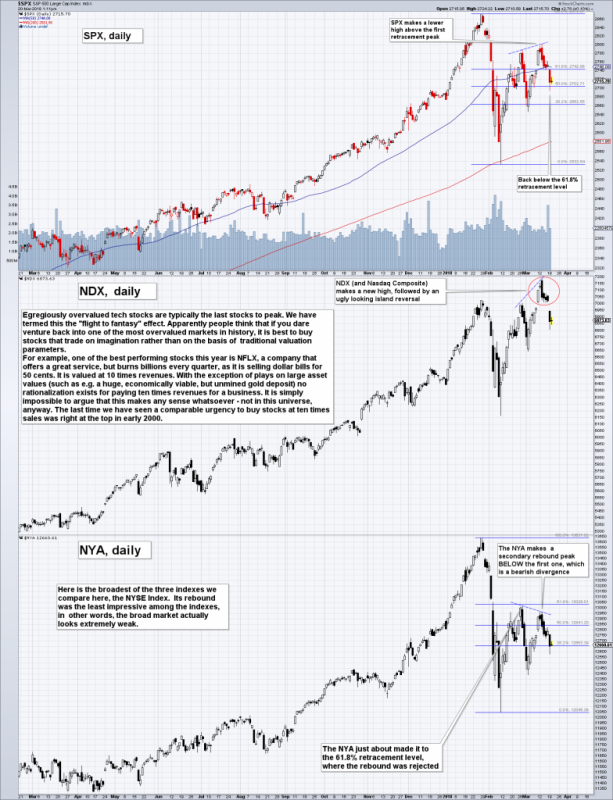
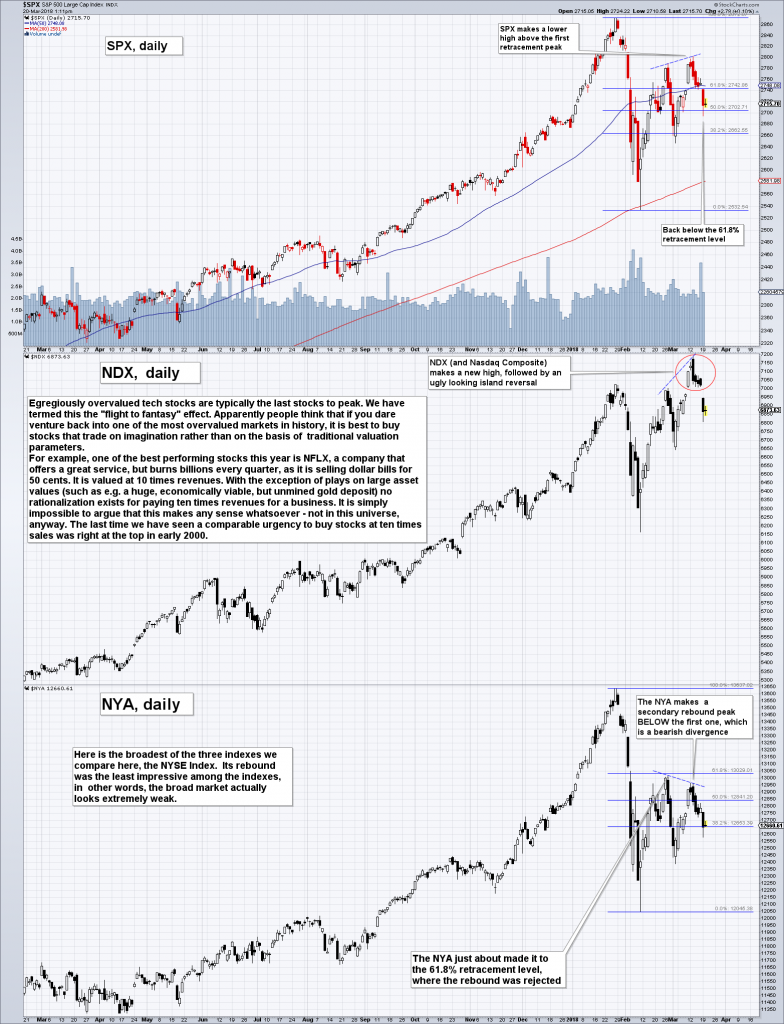
The chart formation built in the course of the early February sell-off and subsequent rebound continues to look ominous, so we are closely watching the proceedings. There are now numerous new divergences in place that clearly represent a major warning signal for the stock market. For example, here is a chart comparing the SPX to the NDX (Nasdaq 100 Index) and the broad-based NYA (NYSE Composite Index).
Read More »
Read More »
Weekly Technical Analysis: 19/03/2018 – USD/JPY, EUR/USD, GBP/USD, NZD/USD, USD/CHF
The USDCHF pair leaned well on 0.9488 level to resume its positive trading, on its way towards our first waited target at 0.9581, as the price moves inside bullish channel that appears on the above chart, supported by the EMA50 that protects trading inside this channel, noting that breaching the targeted level will extend the pair’s gains to reach 0.9675.
Read More »
Read More »
Weekly Technical Analysis: 12/03/2018 – USDJPY, EURUSD, GBPUSD, Gold
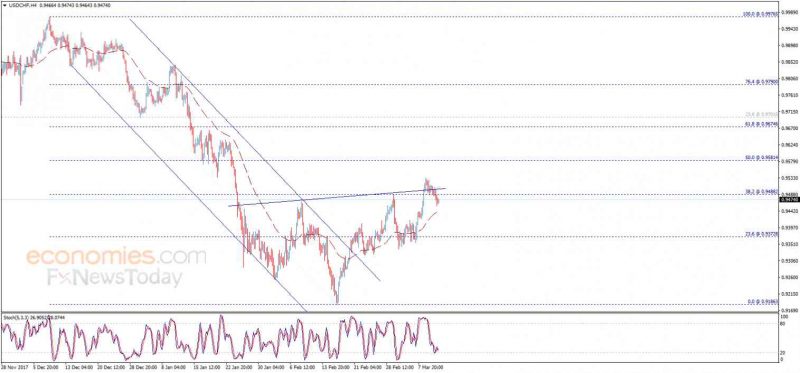
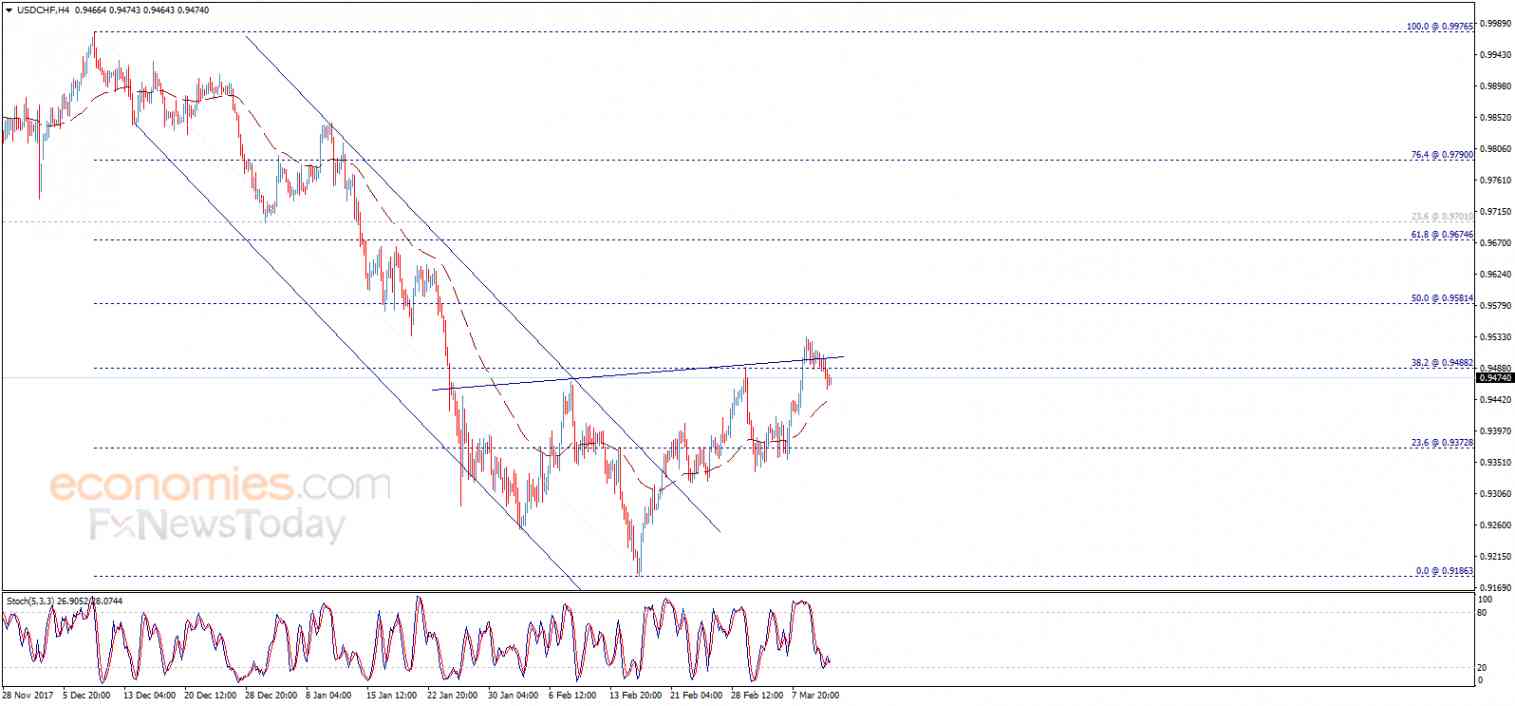
The USDCHF pair traded negatively yesterday to break 0.9488 and settles below it, which stops the positive effect of the recently mentioned bullish pattern and push the price to decline again, targeting heading towards 0.9373 initially.
Read More »
Read More »


