George Dorgan
My articles My siteAbout meMy videosMy books
Follow on:LinkedINTwitterSeeking Alpha
CFA SocietyEconomicBlogs
Seasonality of gold and silverIn the Six Major Fundamental Factors that Determine Gold and Silver Prices we have learned that prices of gold and silver represent the growth difference between Europe and the Emerging Markets on one side and the United States on the other. When the former two are weak, then gold prices tend to fall. When the U.S. economy is weak, however, then gold prices tend to rise. While the BEA adjusts GDP growth for seasonal effects, commodity prices are not seasonally adjusted.
This leads to the question:
The first short answer without further fundamental reasoning is: Gold and silver prices tend to be low at the beginning of the year and higher from September to November, while having a summer trough in June/July.
|
Gold and silver prices are low in January and July and rise at the end of and rise at the end of the year
 click to enlarge
|
Fundamentals behind the gold price seasonalityOur follow-up question, is : Why that? Can I trust these seasonal tendencies?
In Europe one can observe similar tendencies, but – thanks to the European social safety net and milder winters – to a far lower extend. In the Emerging Markets completely different seasonalities can be observed: Think about the Chinese New Year in January/February or temperatures in India and Indonesia that differ completely from the U.S.
|
Seasonality in U.S. Jobs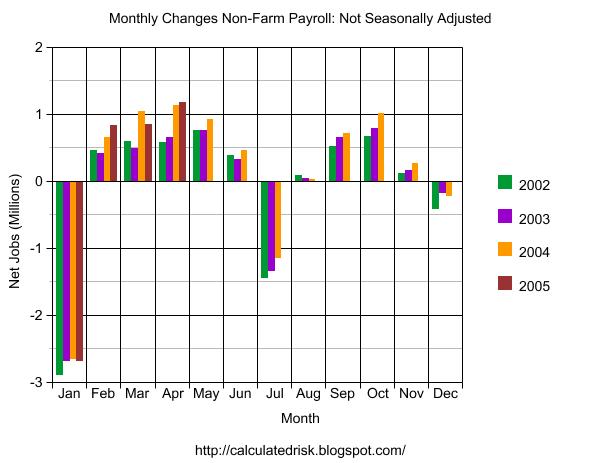 Source Calculated Risk here and newer data here. |
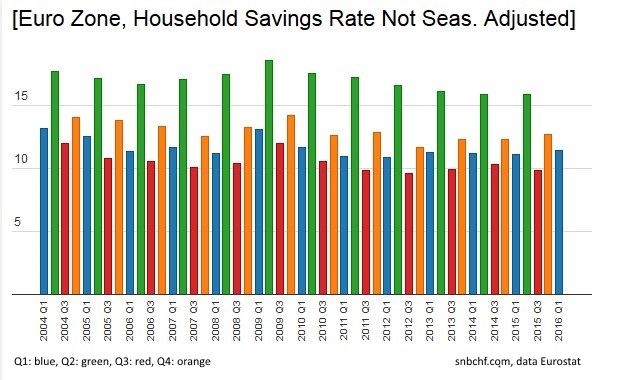
Europeans Save more in Q2 and Spend more in Q3As Eurostat unadjusted data shows: Europeans typically save more in Q2 and Q4, but spend more during the holiday season in the third quarter. American economic data that can show seasonal variations like the Non-Farm Payrolls above, are often not published. Unadjusted data for the GSAVE time series in the FRED database is provided only once year. |
|
Oil Prices Rise from February to April and Fall in Winter
As the graphs show, oil (but also silver prices) tend to increase in the month of February to April. But rising oil prices are negative for U.S. growth. Oil and gasoline prices are the typical culprits for the Sell in May effect.
|
Oil Price Seasonality Oil Price Seasonality, click to enlarge |
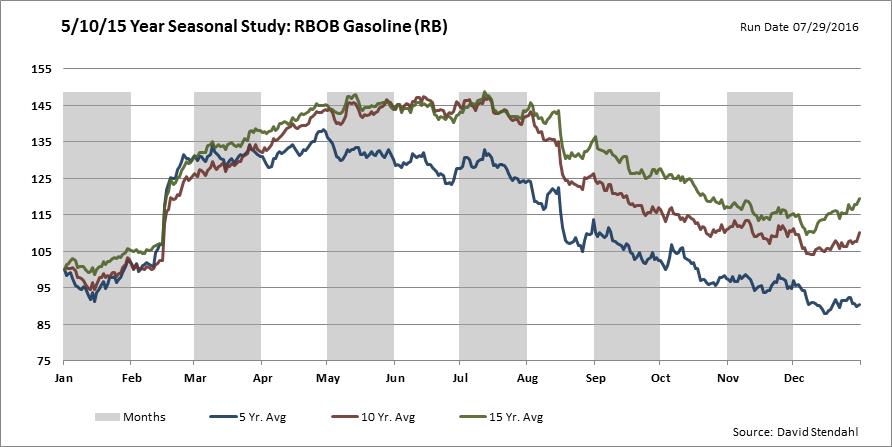
Gasoline Prices Increase from February to August and Fall in WinterBy August/September, however, Europeans begin to spend more and lower their savings rate. The European growth rate may often outpace U.S. growth during this period. Due to higher taxes on fuel, the European economies are less harmed by high fuel prices. Thanks to shale oil this seasonal oil and fuel price tendencies are not so strong anymore. As the graph, 5 year seasonal data exhibits less variations than the 10 or 15 years.
|
|
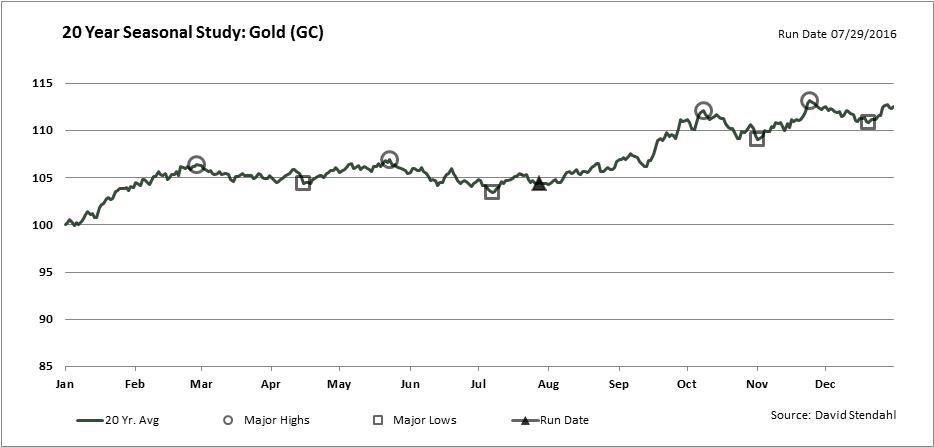
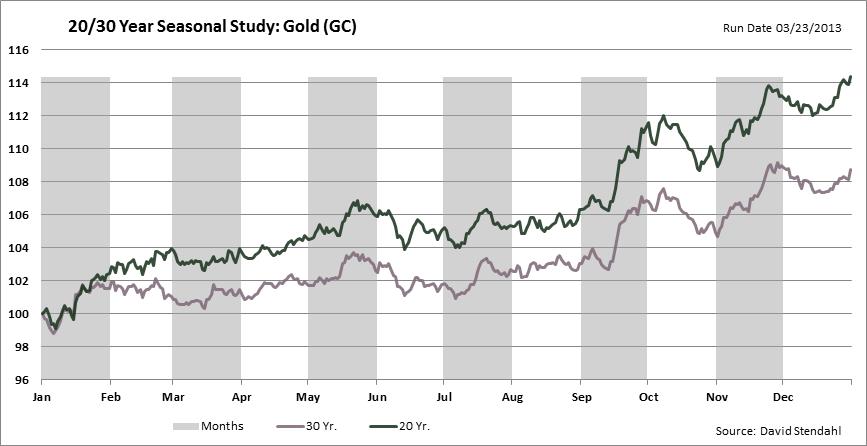
Weakness and strength points for goldThe following 5 year to 30 year seasonal studies show weakness points of gold:
Strength points are:
The graphs are not adjusted for inflation. So one component of the rising gold and silver in between one year, is the rising inflation.
|
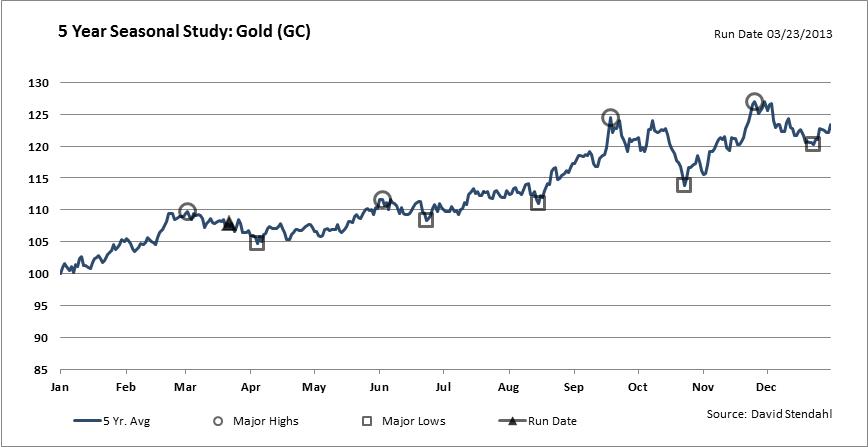 Many know that gold is very volatile in the course of year. Gold prices tend to be low in January and rise between July and November. But what are the fundamental reasons behind this seasonality? - Click to enlarge |
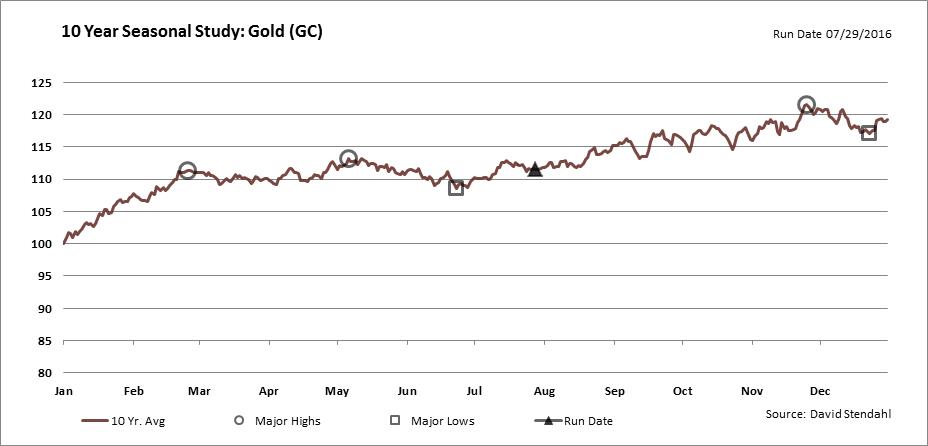 click to enlarge, source David Stendahl |
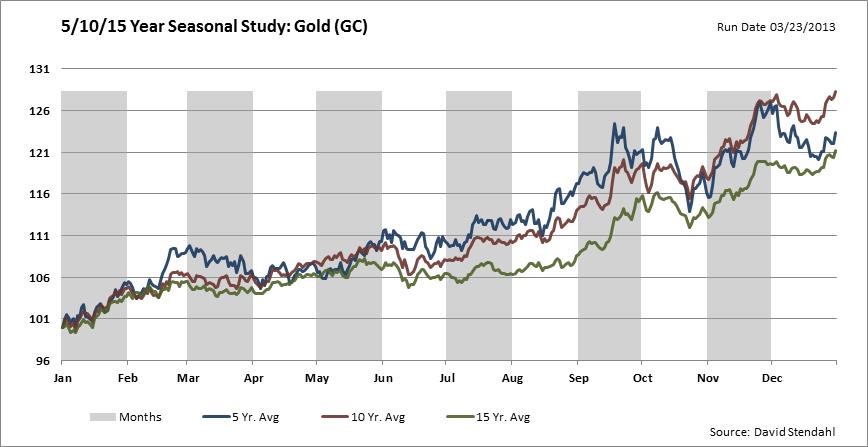 Many know that gold is very volatile in the course of year. Gold prices tend to be low in January and rise between July and November. But what are the fundamental reasons behind this seasonality? - Click to enlarge |
 click to enlarge, source David Stendahl |
 Many know that gold is very volatile in the course of year. Gold prices tend to be low in January and rise between July and November. But what are the fundamental reasons behind this seasonality? - Click to enlarge |