


George Dorgan
My articles My siteAbout meMy videosMy books
Follow on:LinkedINTwitterSeeking Alpha
CFA SocietyEconomicBlogs
Via Vox
On the causes of secular stagnation: China, relative prices, and the collapse of manufacturing
Douglas L. Campbell, 15 April 2014
The 2000s began with the Fed narrowly missing the zero lower bound on short-term interest rates; they ended with the US ensnared in a liquidity trap. Even the economic boom from 2003 to 2007, despite being driven by a housing bubble, was lacklustre by US post-war standards. This has led economists such as Larry Summers to argue that the US may have entered a period of secular stagnation characterised by a prolonged shortfall in aggregate demand. Such shortfalls, Summers asserts, call for very aggressive stabilisation policies just to ensure normal growth.
Causes of the slowdown in aggregate demand
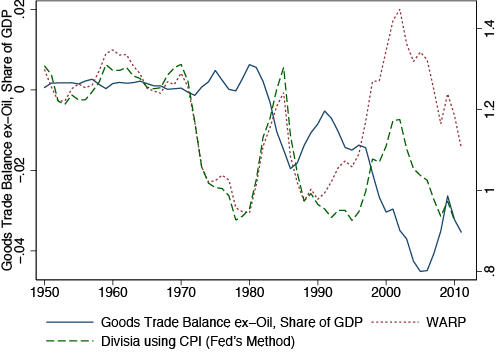
Summers suggested that the so-called Great Reserve Accumulation – the unprecedented rise in foreign reserves by many developing countries – might be a factor since it has effectively reduced aggregate demand in developed economies. This view was confirmed by Dean Baker and Paul Krugman, who also suggested that large US trade deficits since the mid-1990s (plotted in Figure 1) may be part of the underlying problem. This begs the questions: What are the causes of the trade deficit, and what can be done about it?
My job market paper seeks to identify a causal impact of real exchange rate movements on manufacturing output in the US (Campbell 2014). I compare:
- The US experience in the early 2000s to the 1980s, when large fiscal deficits led to a sharp appreciation of the US dollar; and
- Canada’s experience in mid-2000s, when high oil prices and a falling US dollar led to an equally sharp appreciation of the Canadian dollar.
I use disaggregated sectoral data and a difference-in-difference methodology. The key finding is that appreciations in relative unit labour costs lead to disproportionate declines in employment, output, investment and productivity in relatively more open manufacturing sectors.
Through the looking glass: A WARPed view of relative prices
How should changes in relative prices be measured? The Divisia index using the CPI (from Campbell and Pyun 2014) extends the Fed’s widely-used Broad Trade-Weighted Real Exchange Rate Index back to 1950. This index, however, only takes into account changes in bilateral RERs, and does not take into account changes in price levels. Thus, it cannot account for compositional changes in trade towards countries that have systematically lower price levels, such as China. Fahle et al. (2008) argue that a simple weighted average of relative prices (WARP) is a more appropriate looking-glass to view RERs, as it does a better job predicting the current account.
What one finds using this alternate measure is that WARP implies a dollar appreciation of 48% from 1990 to 2002, versus a 21% appreciation using the Fed’s index. Much of this difference comes from the rising share of trade with poor countries, particularly China. What is more, Campbell and Pyun (2014) document that US prices in 2002 were higher relative to other trading partners than at any point since the Great Depression.
Figure 1 Real exchange rate measures vs. the goods trade balance, ex-oil
Relative prices, hysteresis, and the collapse of US manufacturing
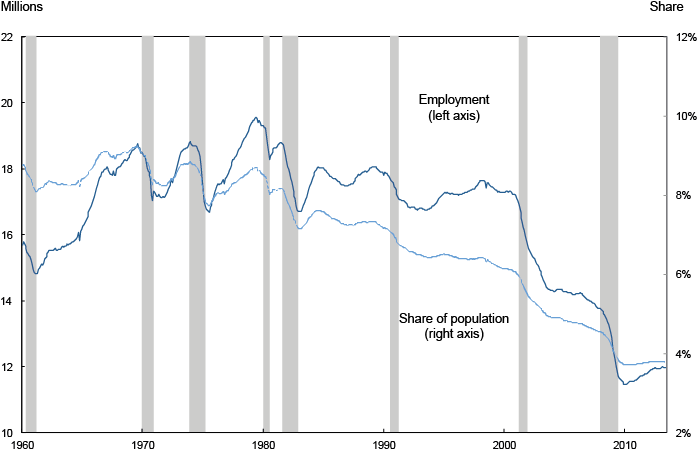
The dollar’s sharp appreciation coincided with large trade deficits and the decline of US manufacturing employment, which had, contrary to popular belief, actually declined little between 1970 and 1998. This has led to a heated debate about the causes of this recent decline in manufacturing employment.
Figure 2 US manufacturing employment
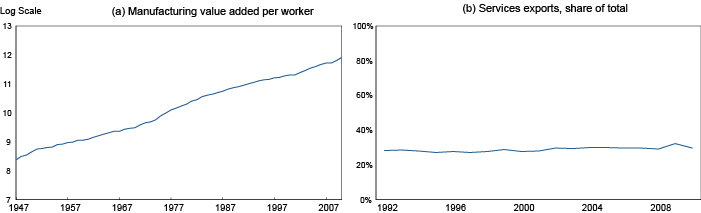
Some economists argue that the decline in manufacturing employment was caused by faster productivity growth in manufacturing and a sectoral shift toward services, reflected by the growing role of services in trade. But panel (a) of Figure 3 shows that aggregate measured labour productivity growth in manufacturing has been roughly constant during the post-war period, while panel (b) reveals that the services share of exports has been surprisingly flat.
Figure 3 Productivity growth and the services share of trade
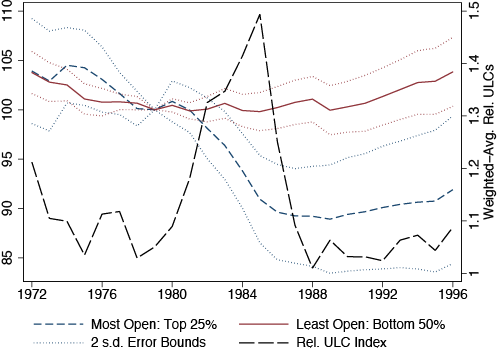
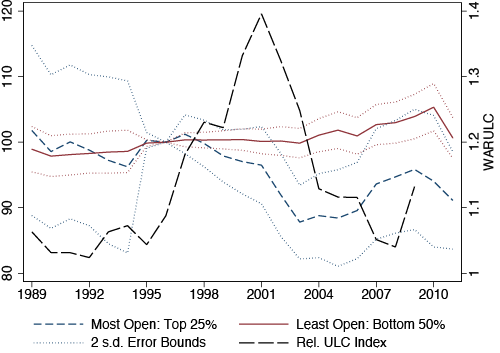
The basic research design of my job market paper is illustrated in Figure 4.
- In panel (a), I compare the evolution of manufacturing employment in sectors which were the most open in terms of trade in 1972 with those sectors which traded the least, after controlling for other factors such as year-specific shocks.
- When the dollar appreciated sharply in the mid-1980s (nearly 50%), more open sectors experienced a decline in employment relative to less exposed sectors.
- Interestingly, after relative unit labour costs returned to parity, the jobs lost in these sectors did not return.
- Much the same pattern is also evident during the early 2000s, as can be seen from panel (b).
Figure 4 Manufacturing employment growth by initial openness
(a) The 1980s dollar bubble
(b) The 2000s manufacturing collapse (NAICs)
A variety of different estimation methods in Campbell (2013) suggest that approximately two million jobs were lost directly as a result of the appreciation in relative unit labour costs, with perhaps another million jobs lost via input-output linkages. This estimate builds on the seminal research of Autor et al. (2013), who diagnosed US manufacturing with the ‘China Syndrome’, finding that increasing exposure to Chinese imports explains a quarter (800,000) of the loss in US manufacturing jobs through 2007.
Policy implications: A return to free trade
The implication is clear – allowing your trading partners to undervalue their currencies as per the Bretton Woods II system results in the loss of manufacturing jobs. During the 2000s, the Fed was able to offset these job losses with loose monetary policy (feeding the housing bubble). However, now that the US is in a liquidity trap, as Paul Krugman has noted, capital inflows in practice subtract directly from aggregate demand. How best to encourage countries such as China to revalue their currencies? Given that direct negotiation seems unlikely to bear fruit, a passive-aggressive approach is likely to yield better results – i.e. have the Fed aim for higher inflation, which functions as a tax on the Great Reserve Accumulators. This policy also makes sense for other reasons given that US inflation is now extremely low.
References
Autor, D., D. Dorn and G. H. Hanson (2013). “The China Syndrome: The Local Labor Market Effects of Import Competition in the US,” American Economic Review 103, 2121–68.
Ball, Lawrence (2013). “The Case for 4% Inflation,” VoxEU.org.
Campbell, D. L. (2014). “Relative Prices, Hysteresis, and the Decline of American Manufacturing,” Job Market Paper, UC Davis.
Campbell, D. L. and J. H. Pyun (2013). “Through the Looking Glass: A WARPed View of Real Exchange Rate History,” UC Davis Department Working Paper.
Dooley, Michael, David Folkerts-Landau, and Peter Garber (2005). “An Essay on the Revived Bretton Woods System.” Federal Reserve Bank of San Francisco Proceedings.
Fahle, S., J. Marquez and C. Thomas (2008). “Measuring US International Relative Prices: A WARP View of the World,” FRB International Finance Discussion Paper.
Houseman, S., C. Kurz, P. Lengermann and B. Mandel (2011). “Offshoring Bias in US Manufacturing,”Journal of Economic Perspectives 25, 111–32.


