


George Dorgan
My articles My siteAbout meMy videosMy books
Follow on:LinkedINTwitterSeeking Alpha
CFA SocietyEconomicBlogs
Mainstream media often speaks of the great shale gas/oil revolution and how it makes the United States more productive and a net exporter of oil. We wanted to go into more details,we compare oil production costs for U.S. shale and global oil producers. It has to be recognized that long-cycle break-Even costs of shale oil have fallen from 77$ to 62$.
As reason for the currently cheap oil we see the combination of two effects:
Demand: Cheap US money supported a Chinese investment boom in factories and housing until 2012. The over-investment phase is followed by lower demand growth.
Supply: The Arab countries need to maintain their social welfare systems, increased production, and – more or less deliberately – kicked high-cost fracking companies out of the market. Moreover, the rivality between Saudi-Arabia and Iran: The Saudis have lower production costs than Iran.
Global Price Comparison for Oil Supply: In the longer term, oil prices must rise to 50$
| Major Exploration Country | Exploration Type and Year of data | Long-Cycle Break-Even (incl. drilling & cost of capital, excl. transport) | Transport Costs to major distribution channel | Profit per Barrel at Price of 50$ |
|---|---|---|---|---|
| Saudi Arabia | Onshore (2014) | 3 | 2 | 45 |
| Middle East ex Saudi | Onshore (2014) | 14 | 4 | 32 |
| Russia | Onshore (2014) | 18 | 10 | 22 |
| Other former USSR | Onshore (2014) | 21 | 10 | 19 |
| Venezuela and Mexico | Onshore (2014) | 32 | 4 | 14 |
| Norway/UK | North-sea (2016) | 45 | 2 | 3 |
| United States | Shale (2016 data) | 45 | 8 | -3 |
| United States | Deep-water | 57 | 2 | -9 |
| Brazil | Ethanol | 66 | 5 | -21 |
| Brazil | Offshore | 80 | 2 | -32 |
| United States | Shale (2014 data) | 65 | 12 | -27 |
| Canada | Sand | 90 | 15 | -55 |
| Europe | Ethanol | 103 | 2 | -55 |
| Europe | Biodiesel | 110 | 2 | -62 |
| Russia | Arctic | 120 | 5 | -75 |
2014 data: The data come from Natixis and were cited by Reuters.
2016 data: The shale oil data comes from the Federal Reserve.
2016 update:Shale Breakevens drop by 20$
|
Long-Cycle Break-Even for Shale Oil by Q3/2015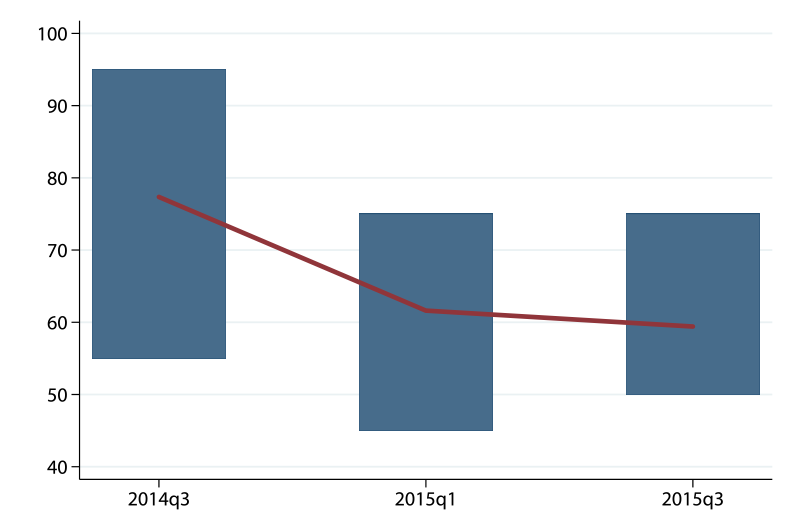 Mainstream media often speaks of the great shale gas/oil revolution and how it makes the United States more productive and a net exporter of oil. We wanted to go into more details,we compare oil production costs for US shale and global oil producers. As reason for the cheap oil we see the combination of two effects: Demand: Cheap US money supported a Chinese investment boom in factories and housing until 2012. The over-investment phase is followed by lower demand growth. Supply: The Arab countries need to maintain their social welfare systems, increased production, and - more or less deliberately - kicked high-cost fracking companies out of the market. - Click to enlarge This figure plots self-reported long-cycle breakevens from the FRB Kansas City energy surveys of 2014q3, 2015q1, and 2015q3. The red line shows the simple average across firms, which fell from almost $80 per barrel in 2014q3 to just over $60 per barrel in 2015q1 and 2015q3. The figure also shows the range of reported breakevens for each quarter (shown by blue bars indicating the space between minimum and maximum values). The breakevens range from about $55 to about $95 in 2014q3. In 2015q1, the range moves down and narrows, with breakevens ranging from about $45 to about $75. In 2015q1, the range tightens further with minimum and maximum values of $50 and $75, respectively. |
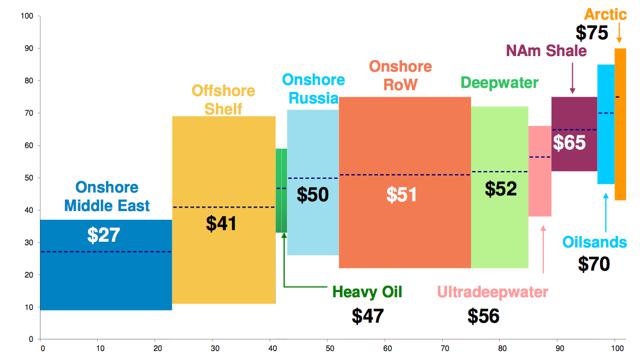
Short-Cycle Oil Production Production Costs Q3/2015This chart includes the distinction between capital expenditures and operational expenditures. It does not indicate the costs for exploring new dwells. |
Oil Production Costs Q3 2015 (Short-Cycle) Oil Production Costs 2015 (click to enlarge)
|
Oil production costs and new oil supply in 2014The Financial Times provided data of as 2014.
|
 Source Financial Times click to enlarge |
Oil production costs as of 2014The next production costs overview is provided by the producer Seadrill, Morgan Stanley Equity Research and the International Energy Agency on Seeking Alpha. Be aware that they do not speak of marginal costs, but of average costs. The difference between the two concepts might be costs for developing new technology for one “marginal unit” more. This data apparently shows a far smaller gap between OPEC and Shale oil. |
 Mainstream media often speaks of the great shale gas/oil revolution and how it makes the United States more productive and a net exporter of oil. We wanted to go into more details,we compare oil production costs for US shale and global oil producers. As reason for the cheap oil we see the combination of two effects: Demand: Cheap US money supported a Chinese investment boom in factories and housing until 2012. The over-investment phase is followed by lower demand growth. Supply: The Arab countries need to maintain their social welfare systems, increased production, and - more or less deliberately - kicked high-cost fracking companies out of the market. - Click to enlarge |
Transport Costs
For major transparency we added the transports costs. Those are typically higher for onshore production far from pipelines and coasts, like in Canada, in Dakota, some locations in Russia and other former USSR countries. The missing access to a major crude distribution channel causes price differences between Ural (Russian) oil or Canadian Light Sweet oil compared to the Brent or WTI standard oil price.
Transport by tankers are nearly as cost-effective as pipelines with a transport price under one dollar per barrel.
Does the comparison of oil companies with oil-producing countries make sense?
There seems to be some pro-US propaganda, here by the recognized author Barry Ritholz.
Russia needs crude at $101 a barrel to break even. Venezuela and Nigeria need $120. Iran needs $136. US shale companies needs $42. — Downtown Josh Brown (@ReformedBroker) December 1, 2014
It makes no sense to compare companies with countries. Saudi-Arabia or Russia are able to run fiscal deficits for many years (like the US does for many years), a firm must remain profitable.
Countries may raise taxes -effectively income tax in Russia is at only 13%. Countries may diversify their economy when a weak currency makes labor more competitive. Oil companies may only hedge their exposure to falling prices (further below).
For a country, the current account and the total balance of payments remains the key criterion. Russian oil incomes are in dollars, fiscal expenses are in rubles. (see the full detail and discussions in my article on Seeking Alpha)
Related pages
See also the detailed costs estimates for shale oil and Canadian tar oil provided by major investment houses.
compare the data with expected Asian additional demand
See also the oil price estimates for 2020 until 2035 given in 2014.


1 comments
lovelife1955
2014-12-01 at 19:17 (UTC 2) Link to this comment
All these writers ignore the basic rule of economics. In Qatar you probably pay twice as much for a Prada handbag as you do in New York. Does that stop people buying handbags? Clearly not. So what if the USA or Canada pays $80 a barrel instead of $50 per barrel. This is especially true of the USA where gas is currently (october 2014) around 75 cents a litre even based on 100 bucks a barrel. The only REAL losers are the countries totally reliant on oil for income.