


George Dorgan
My articles My siteAbout meMy videosMy books
Follow on:LinkedINTwitterSeeking Alpha
CFA SocietyEconomicBlogs
For us the Net National Savings Rate is the best alternative indicator to GDP growth. The Net National Savings Rate (NNSR) is rather positively correlated with the change in wealth, with the establishment of future productive capacity, the price of government bonds and currency valuations. The relationship of GDP growth to those four criteria, however, is often a negative correlation.
We critized GDP growth that has become mostly an indicator of consumption and activity. We emphasized that strong GDP growth, in particular consumption-driven (hyper-) activity may lead to a depreciating currency, falling government bond prices and wealth in real terms.
In this post we will provide an alternative indicator that is able to measure the ability to produce and to build an economic future. The Gross National Savings Rate is derived by deducting final consumption expenditure from Gross national disposable income, and consists of personal saving, plus business saving, plus government saving, but excludes foreign saving. The figures are presented as a percent of GDP. A negative number indicates that the economy as a whole is spending more income than it produces, thus drawing down national wealth (dissaving) (see World fact book definition)
Net National Savings in % of gross national income (NNSR): The “net” means that it gross savings are adjusted by the consumption of fixed capital. This depreciation, the cost of replacements for existing infrastructure is deducted from gross savingsv The World Bank provides the NNS-Rate including a history of data from 1971 to 2012. Unfortunately 2013 is still missing.
As opposed to GDP growth, the NNS-Rate is able to:
- Measure the change in wealth. Wealth is increased by net national savings each year plus/minus a certain valuation effect. Wealth may consist of assets, either in the form of fixed (machines, homes, state investments, infrastructure) or financial investments, either the ones of the private sector or the ones of the state, like state pensions.
- We prefer to ignore the valuation effect because it is driven by central bank policies and asset bubbles and busts.
- Savings are the basis for investments; building productive capacity is for us the major driver of an economic future. Even if banks may create credit out of “thin air”: nowadays countries with low savings have low investments too. Useful investments and fixed capital building leads to more “sustainable” investment-driven GDP growth.
- As opposed to GDP, net national savings are able to measure savings that are not invested in the local economy. Switzerland is currently building a second productive economy outside of the home country, but owned by Swiss firms. The size of this economy can be roughly measured by the difference between gross national income (GNI) and gross national product (GDP).
- As opposed to GDP, net national savings can quantify the desire to be less active and to consume less today but to postpone consumption to the future. This happens in particular during economic crises or in austerity phases. When austerity happens only in some countries and not globally (like during the Great Depression), then – for example – a fall in consumption by 10% triggers a production decline by around 7 to 9%. The difference can be observed in an improvement of the trade balance, visible today in the austerity-ridden euro countries.
- Rising net national savings during an austerity period typically coindice with both low inflation and increases wealth. Both inflation and wealth are the main drivers of government bond yields. The rapid decline of peripheral bond yields is for us mainly the effect of rising net national savings and consequently low inflation.
- For emerging and less developed economies high savings and rising current account balances provide safety against a currency devaluation.
- Typically economies with older infrastructure have higher costs of depreciation. The “net rate” in the NNS-Rate helps to incorporate this adjustment.
Finally the World Bank makes an additional adjustment in order to obtain the “adjusted net national savings rate” and incorporates depletion of natural resources, but adds education expenditure to the value.
Overview ChartAs we already pointed out in our post on GDP, among the bigger global economies China was the leader in both GDP growth and in NNSR. Hence the NNSR is not a pure counter indicator to GDP, but it provides additional information in a single factor. NNSR is the best indicator for contrarian investment, because countries with high savings behave better when the global economy stutters. A quick overview gives this graph from the Swiss National Bank, it focuses on Gross national savings, advanced economies focused on spending, while in particular developing Asia concentrated on savings and investment.
|
 Savings Rate Emerging vs. Advanced Economies 1980-2011, source1 |
|
Oil ProducersThe following contains the full details for the most important “savings-based” countries, the first one are the oil producers. The very latest data with the dropping oil price is not yet inside. We combined the Arab nations into the World Bank aggregate “Arab World”.
|
|
Other Savings-Based CountriesThe following graph shows the high savings of China, Philippines. Japan had high savings rates in the 1990s, but with their ageing the rate has fallen to zero.
|
|
The Net National Saving for the WorldThe most important insight is that the NNSR for the whole world has barely changed. In 1975, it was 10.5%. With high interest rates, it rose to 12.5% in 1978. With the crisis in 1983, it fell to 7.8%. Then the rate rose again to nearly 10% in 1989. Then it came down to 7.2% in 2002 and rose again to 10.7% in 2007. After a dive in the crisis of 2009 to 7.8%. With our current recovery the world savings rate is approaching the levels of 1978 again – this despite far lower interest rates.
|
Net National Savings Rate World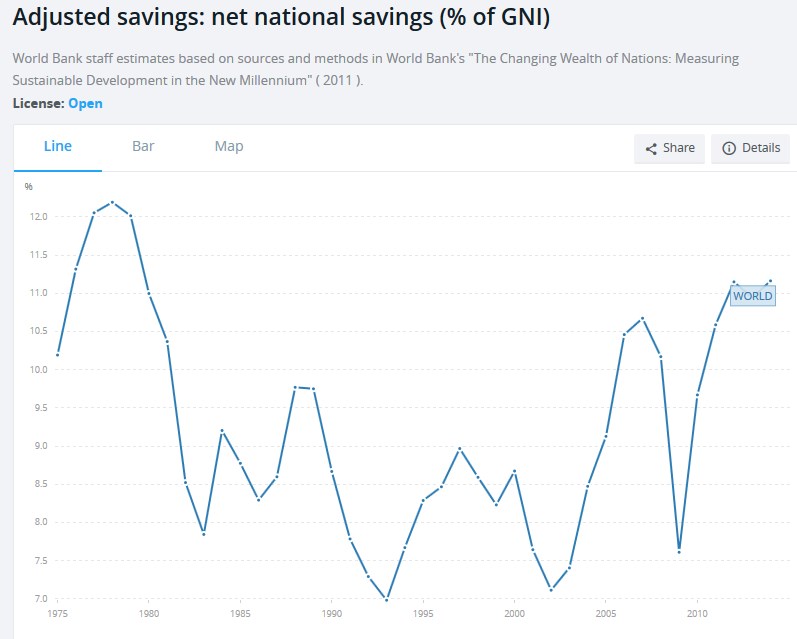 . |
Savings Glut or Global Unbalancing?
Bernanke attributed this phase to the so-called “savings glut” in Asia.
Michael Pettis prefers to call it “Global Unbalancing”, namely a phase when Chinese savings rates were rising and US savings rates were falling.
In the second part of this article, we will focus on the consumption-driven economies. We will even argue that those were saving less than they should, which is largely the reason for their Great Stagnation.
In the hierarchy nothing changed between 1982 and today. China remains the leader, no matter whether Chinese lived in communism or nearly capitalism today. The Chinese seem to have a strong desire for high savings. Supporters of the modern monetary theory claim that the problems lies in the totalitarian government that obliges them to save a lot. Other economists claim that the reason lies in the missing social net.
The behavioral reasons behind high Asian savings
But looking at the savings rate of other Asian countries, even democratic states, shows that the Asian mentality might be the reason behind it.
- Asians have a stronger desire for security, what savings offer.
- The Asian power distance between employer and employee enforces the importance of the leader, the entrepreneur.
- Moreover, the collective Asian society does not want unemployment, employees prefer to renounce salary hikes in favor of the collective. Japan shows the same phenomenon with falling nominal wages for decades.
- India is maybe the best success story. Since the 1980s they managed to increase the NNSR from 10% to 20%. This high value helps to avoid the heavy currency depreciation phases, often seen until the 1990s.
- After years of high NNSR, the ageing Japanese society has considerably reduced the savings rate, in particular since 2007/2008 when the U.S. started to increase savings and when the Japanese trade surplus started to fall.
More on the cultural reasons for the high NNSR in Asia here
The oil-producing countries of Russia, Nigeria, Norway, Venezuela and the Arab world have had high savings for many years. This helped to improve their infrastructure and future productive capacity. The recession of the early 1990s showed a sharp reduction in the oil price and contraction of the national savings in the Arab World.
The reader should verify the graph against the long-term development of nations and currencies captured in Growthers’ Balances and Imbalances of Payments.
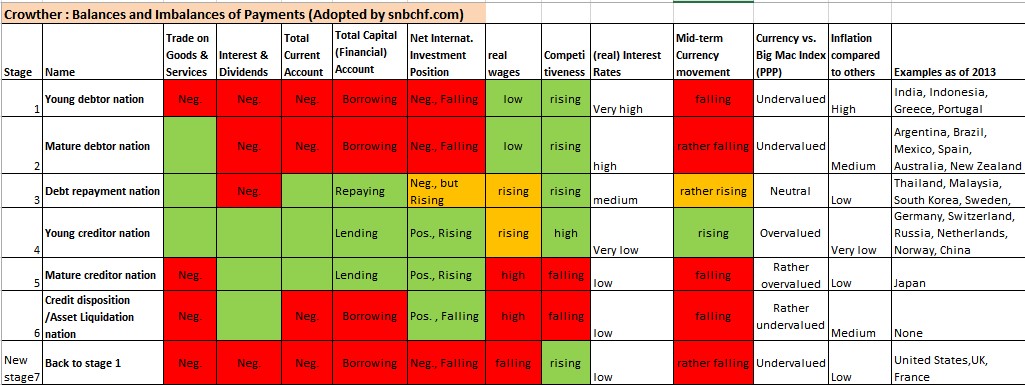 Most of these countries are either young debtor nations (e.g. India, Vietnam or Indonesia) with an important need for high savings/repayments, mature debtor nations (like Malaysia), debt repayment nations (e.g. here Russia’s BoP), young creditors (like China) and “young” creditor nations (like Norway or Switzerland, the Arab nations). After years of being a young creditor nation, Japan has quickly become nearly a credit disposition country.
References:
World Bank: Adjusted Net National Savings in % of GNI
World Bank: Terminology of the Adjusted Net National Savings
In the NBER paper “AN ESSAY ON THE REVIVED BRETTON WOODS SYSTEM”, of 2003, Michael Dooley called our “production- and investment-driven” countries also Trade Account countries, in particular because they used a fixed exchange, but accumulated currency reserves and trade surpluses.
- Danthine, Jean-Pierre. 2012. ‘A world of low interest rates’ Swiss National Bank. Online, March 2012 [↩]


