


George Dorgan
My articles My siteAbout meMy videosMy books
Follow on:LinkedINTwitterSeeking Alpha
CFA SocietyEconomicBlogs
Contributed by Lance Roberts of Streettalk Live
original URL
I have often spoken of the disconnect between Wall Street and Main Street. While asset prices are inflated by continued interventions of monetary policy from the Federal Reserve, boosting Wall Street profits and widening the wealth gap between the top 20% of Americans and the rest, “Main Street” continues to suffer a from a rising cost of living and falling wage growth. Just recently Gallup released the following survey:
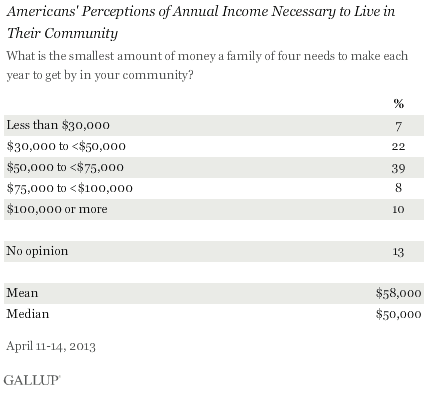
“The federal poverty threshold for a family of four is just under $24,000; however, Americans believe such a family unit living in their community needs more than double that — $58,000, on average — just to ‘get by.’ That estimate reflects 29% of Americans saying these families need up to $50,000 in annual income, 47% saying they need between $50,000 and $99,999, and 10% saying they need $100,000 or more.”
The problem is that as the cost of living rises over time due to the effects of inflation – median household incomes have fallen. The following chart shows the seasonally adjusted median household income through March of 2013 as compared to Gallup’s poll of family living needs.

The shortfall is quite evident. The obvious question that follows is:
“Where does the money come from to fill the gap between living standards and incomes?”
The chart below answers that question. The chart shows the difference between the $58,000 need for a family unit and median incomes, defined as the “income gap,” and then compared to household credit.

Besides the very brief forced deleveraging of balance sheets during the financial crisis, as households defaulted on debt and financial institutions cut credit lines, consumers have returned to credit to supplement incomes with a vengeance since 2011.
Ample Evidence
There is considerable evidence behind the current dislocation between Corporate America and Main Street. Real unemployment remains extremely elevated as witnessed by the labor force participation rate and employment-to-population ratio at levels not seen since the early 1980’s.
I recently published a piece on the “5 Questions That Every Market Bull Should Answer” discussing the disconnect between the “have’s” and the “have not’s” stating:
“Suppressed wage growth, layoffs, cost-cutting, productivity increases, accounting gimmickry and stock buybacks have been the primary factors in surging profitability. However, these actions are finite in nature and inevitably it will come down to topline revenue growth. However, since consumer incomes have been cannibalized by suppressed wages and interest rates – there is nowhere left to generate further sales gains from in excess of population growth.”
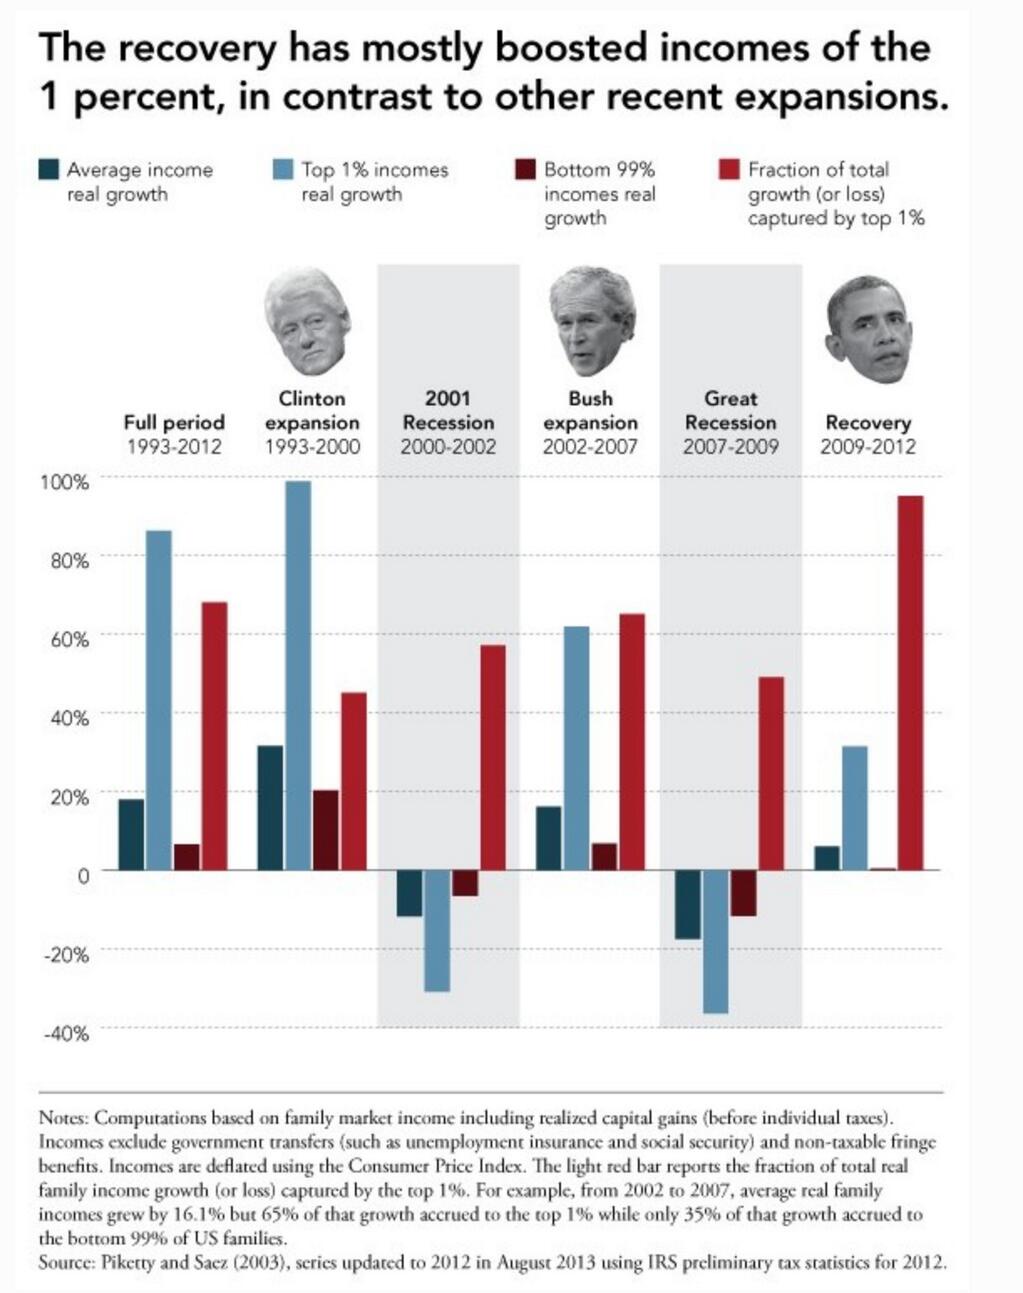
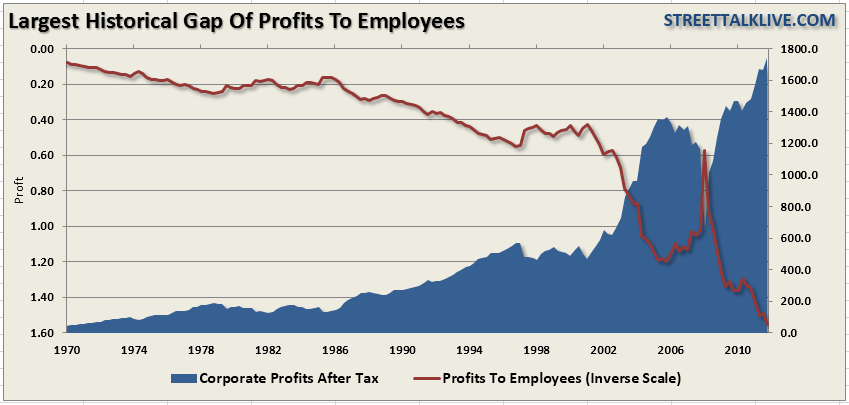
This is why the gap between corporate profits and the number of working employees is the highest level on record. Fewer workers, higher productivity and longer hours for the same pay, or less, equals higher corporate profits. This is great for executives, primarily the top 10% of wage of earners, who are compenstated from rising share prices, bonuses and other performance related compensation. However, for the “working stiff,” there is little reward for their labor.
“Welfaring Of America”
At $58,000, Americans’ perceptions of the amount it takes just to get by in their community is substantially higher that the national median household income. This level is also well out of reach for a bulk of the lower 30% of American households.
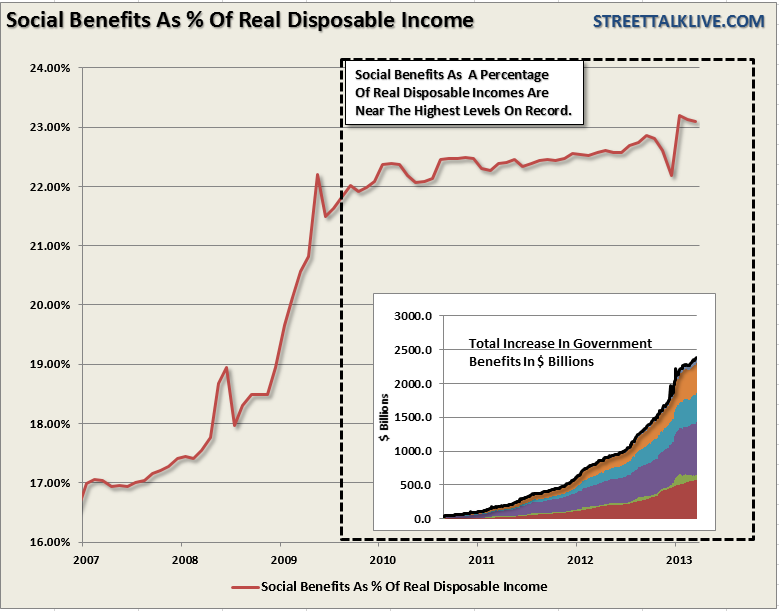
However, this gap between incomes and living standards goes a long way to explaining the “welfaring” of America. As incomes have waned against a rising cost of living – it is not surprising to see more individuals receiving income supplements in the mail either from “food stamps”, social security benefits or disability claims. All of which are currently at record levels. The chart below shows the level of social security benefits as a percentage of disposable personal incomes which is currently near the highest level on record.
“How long can the disconnect last between Wall Street and Main Street? “
There is no clear answer for that as consumers have shown a willingness to draw down savings rates to historically low levels while quickly returning to cheap credit forgetting the disaster that it caused them not so long ago. However, in reality, when you have a family to feed, clothe and house – it really doesn’t matter what is logical, but what is necessary, regardless of the consequences down the road. Of course, for many American’s today, the only real difference between now and the “bread lines” of the 30’s is that the “bread” is delivered in the mail rather than at the “soup kitchen” on the corner.
Fox 26: The Disconnect Between The Market & Economy
In an exclusive interview on Fox 26 with Jose Grinon and Melissa Wilson discussing the disconnect between the financial markets and the real economy. I recently discussed this idea in much greater detail in an article entitled “The Great Disconnect: Markets Vs. Economy” wherein I stated:
“So, while the markets have surged to “all-time highs” – for the majority of Americans who have little, or no, vested interest in the financial markets their view is markedly different. While the mainstream analysts and economists keep hoping with each passing year that this will be the year the economy comes roaring back – the reality is that all the stimulus and financial support available from the Fed, and the government, can’t put a broken financial transmission system back together again. Eventually, the current disconnect between the economy and the markets will merge. My bet is that such a convergence is not likely to be a pleasant one.”
Weak wage growth, elevated levels of unemployment, and rising prices for food and energy continue to chip away at the fabric of the American economy even though the Fed continues to inflate asset prices further. The reality is that we are like inflating the next asset bubble as I discussed in early March of this year:
Don’t misunderstand me. As we wrote last week – it is certainly conceivable that the markets could attain all-time highs. The speculative appetite combined with the Fed’s liquidity is a powerful combination in the short term. However, the increase in speculative risks combined with excess leverage leave the markets vulnerable to a sizable correction at some point in the future.
The only missing ingredient for such a correction currently is simply a catalyst to put “fear” into an overly complacent marketplace. There is currently no shortage of catalysts to pick from whether it is further fiscal policy missteps stemming from the upcoming “Debt Ceiling” debate, a resurgence of the Eurozone crisis, or an unexpected shock from an area yet to be on our radar.
In the long term it will ultimately be the fundamentals that drive the markets. Currently, the deterioration in the growth rate of earnings, and economic strength, are not supportive of the speculative rise in asset prices or leverage. The idea of whether, or not, the Federal Reserve, along with virtually every other central bank in the world, are inflating the next asset bubble is of significant importance to investors who can ill afford to once again lose a large chunk of their net worth.
It is all reminiscent of the market peak of 1929 when Dr. Irving Fisher uttered his now famous words: “Stocks have now reached a permanently high plateau.” The clamoring of voices that the bull market is just beginning is telling much the same story. History is repleat with market crashes that occurred just as the mainstream belief made heretics out of anyone who dared to contradict the bullish bias.
Does an asset bubble currently exist? Ask anyone and they will tell you “NO.” However, maybe it is exactly that tacit denial which might just be an indication of its existence.
;
original URL
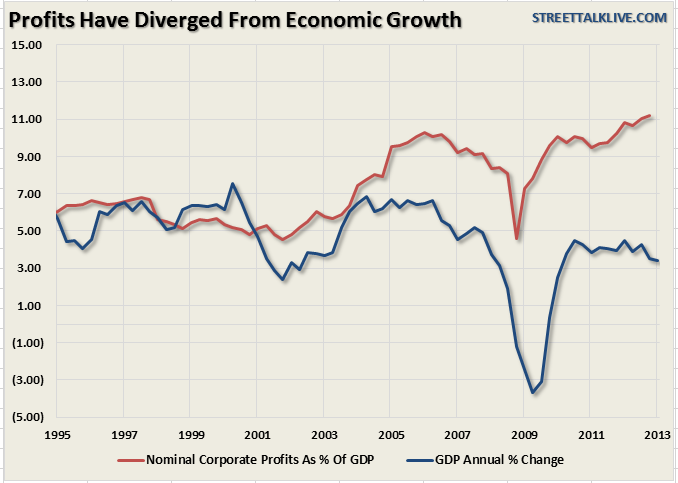
Question: How long can corporate profits remain diverged from weakening economic growth?
I would like to give an answer:
Big U.S. firms—often called “multinationals,” for good reason—have increasingly followed global growth, with about 40 percent of profit for firms listed in the S&P 500 stock index now coming from overseas. Foreign exposure allows U.S.-based companies to capitalize on rapid growth in emerging markets like China, India, and Latin America, and earn much stronger profits than if they were totally dependent on the struggling U.S. economy. source


